Zip Codes with the Highest Percentage of Population Employed in Community & Social Service in Acton, MA
RELATED REPORTS & OPTIONS
Community & Social Service
Acton
Compare Zip Codes
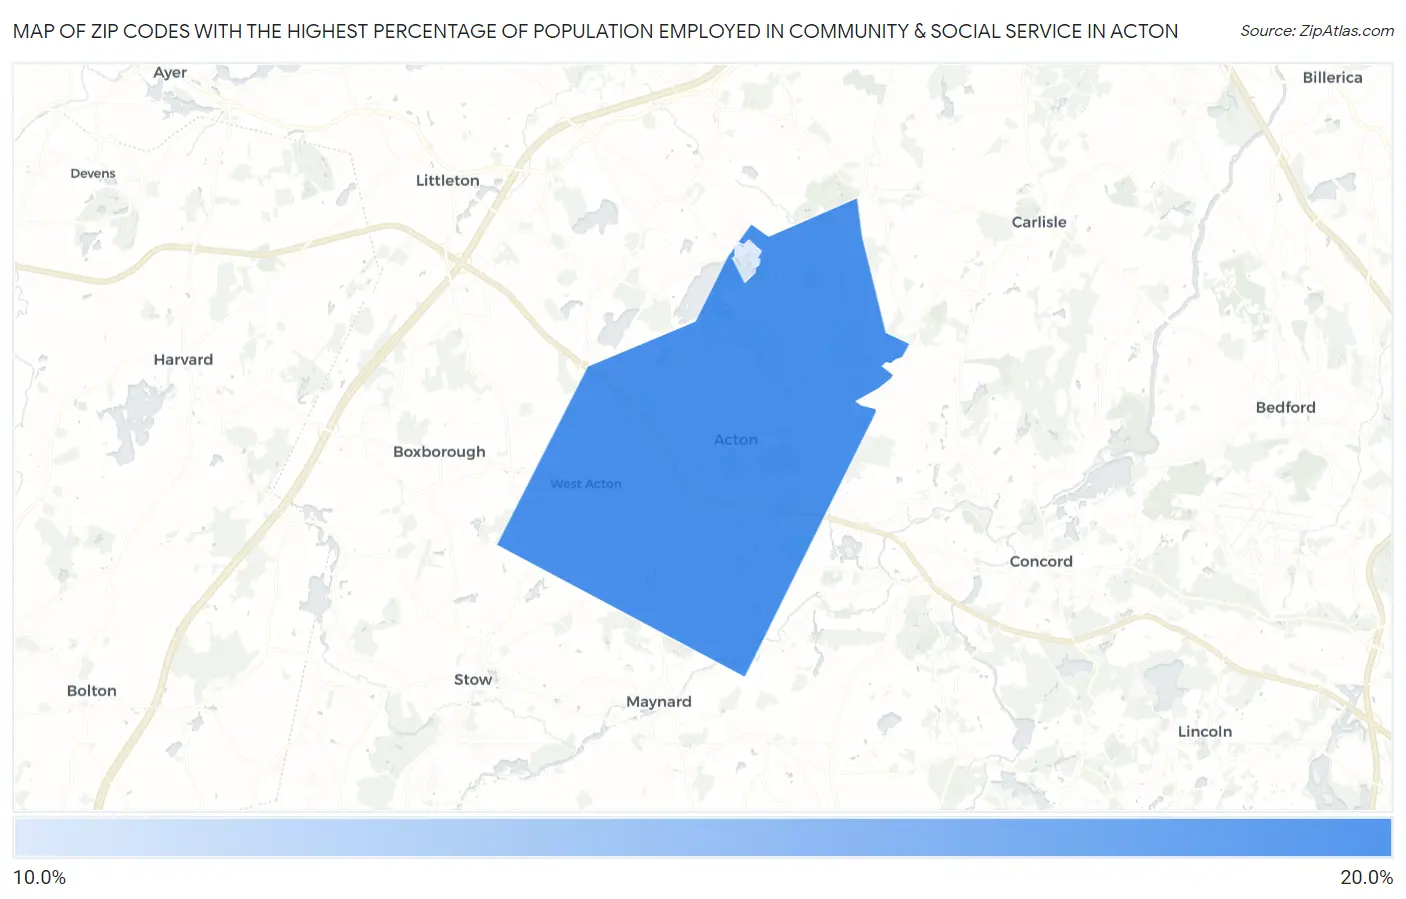
Map of Zip Codes with the Highest Percentage of Population Employed in Community & Social Service in Acton
11.4%
17.4%
Zip Codes with the Highest Percentage of Population Employed in Community & Social Service in Acton, MA
| Zip Code | % Employed | vs State | vs National | |
| 1. | 01720 | 17.4% | 13.5%(+3.91)#119 | 11.2%(+6.20)#3,104 |
| 2. | 01718 | 11.4% | 13.5%(-2.14)#340 | 11.2%(+0.155)#10,739 |
1
Common Questions
What are the Top Zip Codes with the Highest Percentage of Population Employed in Community & Social Service in Acton, MA?
Top Zip Codes with the Highest Percentage of Population Employed in Community & Social Service in Acton, MA are:
What zip code has the Highest Percentage of Population Employed in Community & Social Service in Acton, MA?
01720 has the Highest Percentage of Population Employed in Community & Social Service in Acton, MA with 17.4%.
What is the Percentage of Population Employed in Community & Social Service in Massachusetts?
Percentage of Population Employed in Community & Social Service in Massachusetts is 13.5%.
What is the Percentage of Population Employed in Community & Social Service in the United States?
Percentage of Population Employed in Community & Social Service in the United States is 11.2%.