Zip Codes with the Highest Percentage of Population Employed in Real Estate, Rental & Leasing in Acton, MA
RELATED REPORTS & OPTIONS
Real Estate, Rental & Leasing
Acton
Compare Zip Codes
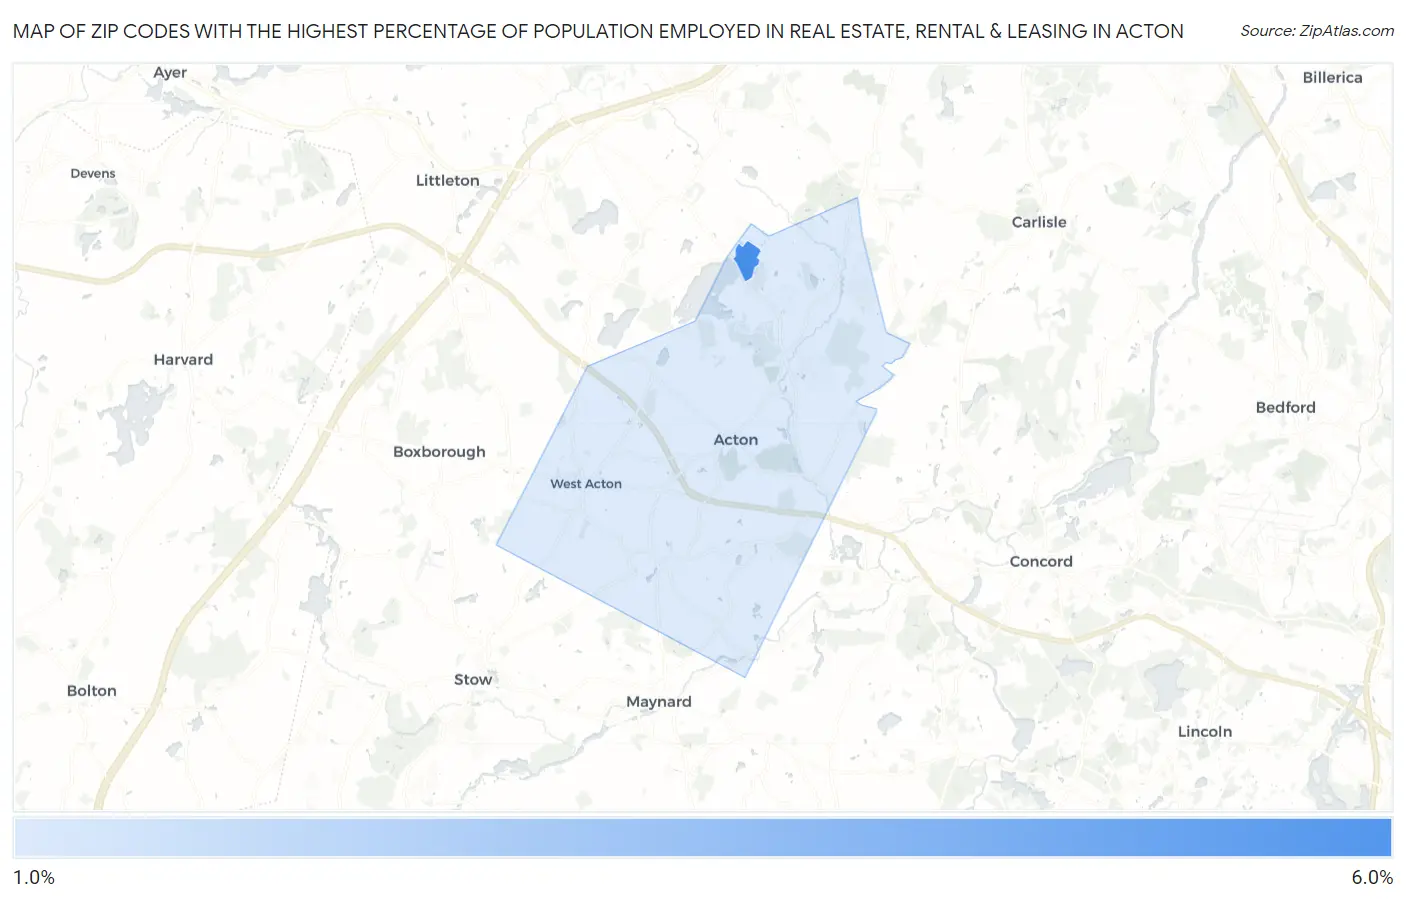
Map of Zip Codes with the Highest Percentage of Population Employed in Real Estate, Rental & Leasing in Acton
1.9%
5.7%
Zip Codes with the Highest Percentage of Population Employed in Real Estate, Rental & Leasing in Acton, MA
| Zip Code | % Employed | vs State | vs National | |
| 1. | 01718 | 5.7% | 1.7%(+4.03)#15 | 1.9%(+3.79)#1,083 |
| 2. | 01720 | 1.9% | 1.7%(+0.256)#170 | 1.9%(+0.023)#8,371 |
1
Common Questions
What are the Top Zip Codes with the Highest Percentage of Population Employed in Real Estate, Rental & Leasing in Acton, MA?
Top Zip Codes with the Highest Percentage of Population Employed in Real Estate, Rental & Leasing in Acton, MA are:
What zip code has the Highest Percentage of Population Employed in Real Estate, Rental & Leasing in Acton, MA?
01718 has the Highest Percentage of Population Employed in Real Estate, Rental & Leasing in Acton, MA with 5.7%.
What is the Percentage of Population Employed in Real Estate, Rental & Leasing in Massachusetts?
Percentage of Population Employed in Real Estate, Rental & Leasing in Massachusetts is 1.7%.
What is the Percentage of Population Employed in Real Estate, Rental & Leasing in the United States?
Percentage of Population Employed in Real Estate, Rental & Leasing in the United States is 1.9%.