Zip Codes with the Highest Percentage of Population Employed in Health Diagnosing & Treating in Lowell, MA
RELATED REPORTS & OPTIONS
Health Diagnosing & Treating
Lowell
Compare Zip Codes
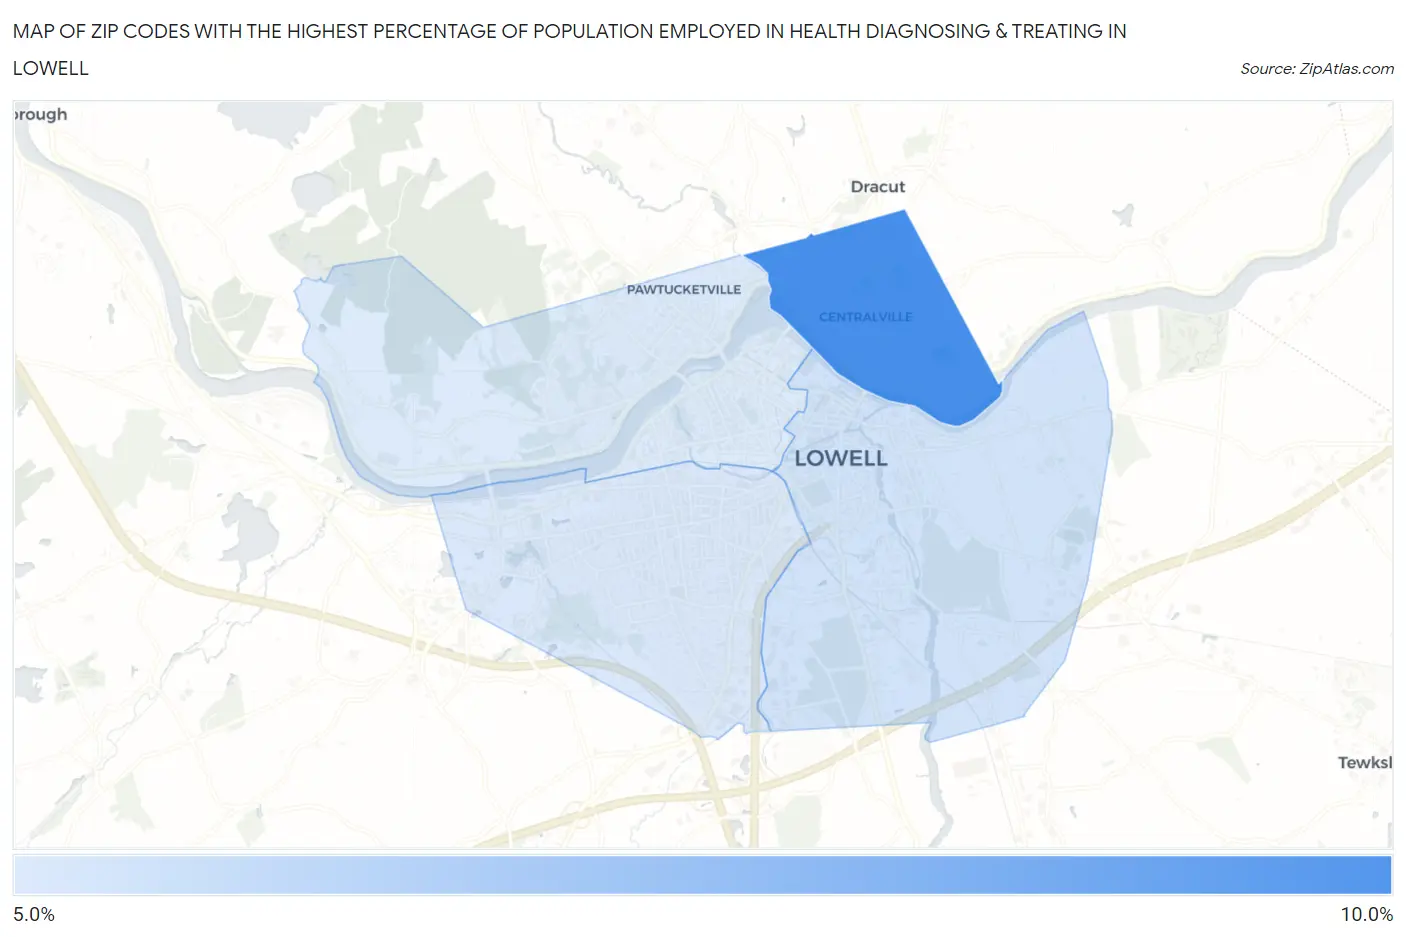
Map of Zip Codes with the Highest Percentage of Population Employed in Health Diagnosing & Treating in Lowell
5.2%
8.2%
Zip Codes with the Highest Percentage of Population Employed in Health Diagnosing & Treating in Lowell, MA
| Zip Code | % Employed | vs State | vs National | |
| 1. | 01850 | 8.2% | 6.9%(+1.33)#155 | 6.2%(+1.99)#6,920 |
| 2. | 01852 | 5.4% | 6.9%(-1.51)#374 | 6.2%(-0.847)#16,183 |
| 3. | 01851 | 5.2% | 6.9%(-1.69)#388 | 6.2%(-1.03)#16,878 |
| 4. | 01854 | 5.2% | 6.9%(-1.75)#392 | 6.2%(-1.09)#17,097 |
1
Common Questions
What are the Top 3 Zip Codes with the Highest Percentage of Population Employed in Health Diagnosing & Treating in Lowell, MA?
Top 3 Zip Codes with the Highest Percentage of Population Employed in Health Diagnosing & Treating in Lowell, MA are:
What zip code has the Highest Percentage of Population Employed in Health Diagnosing & Treating in Lowell, MA?
01850 has the Highest Percentage of Population Employed in Health Diagnosing & Treating in Lowell, MA with 8.2%.
What is the Percentage of Population Employed in Health Diagnosing & Treating in Lowell, MA?
Percentage of Population Employed in Health Diagnosing & Treating in Lowell is 5.6%.
What is the Percentage of Population Employed in Health Diagnosing & Treating in Massachusetts?
Percentage of Population Employed in Health Diagnosing & Treating in Massachusetts is 6.9%.
What is the Percentage of Population Employed in Health Diagnosing & Treating in the United States?
Percentage of Population Employed in Health Diagnosing & Treating in the United States is 6.2%.