Zip Codes with the Highest Percentage of Population Employed in Health Diagnosing & Treating in Arlington, MA
RELATED REPORTS & OPTIONS
Health Diagnosing & Treating
Arlington
Compare Zip Codes
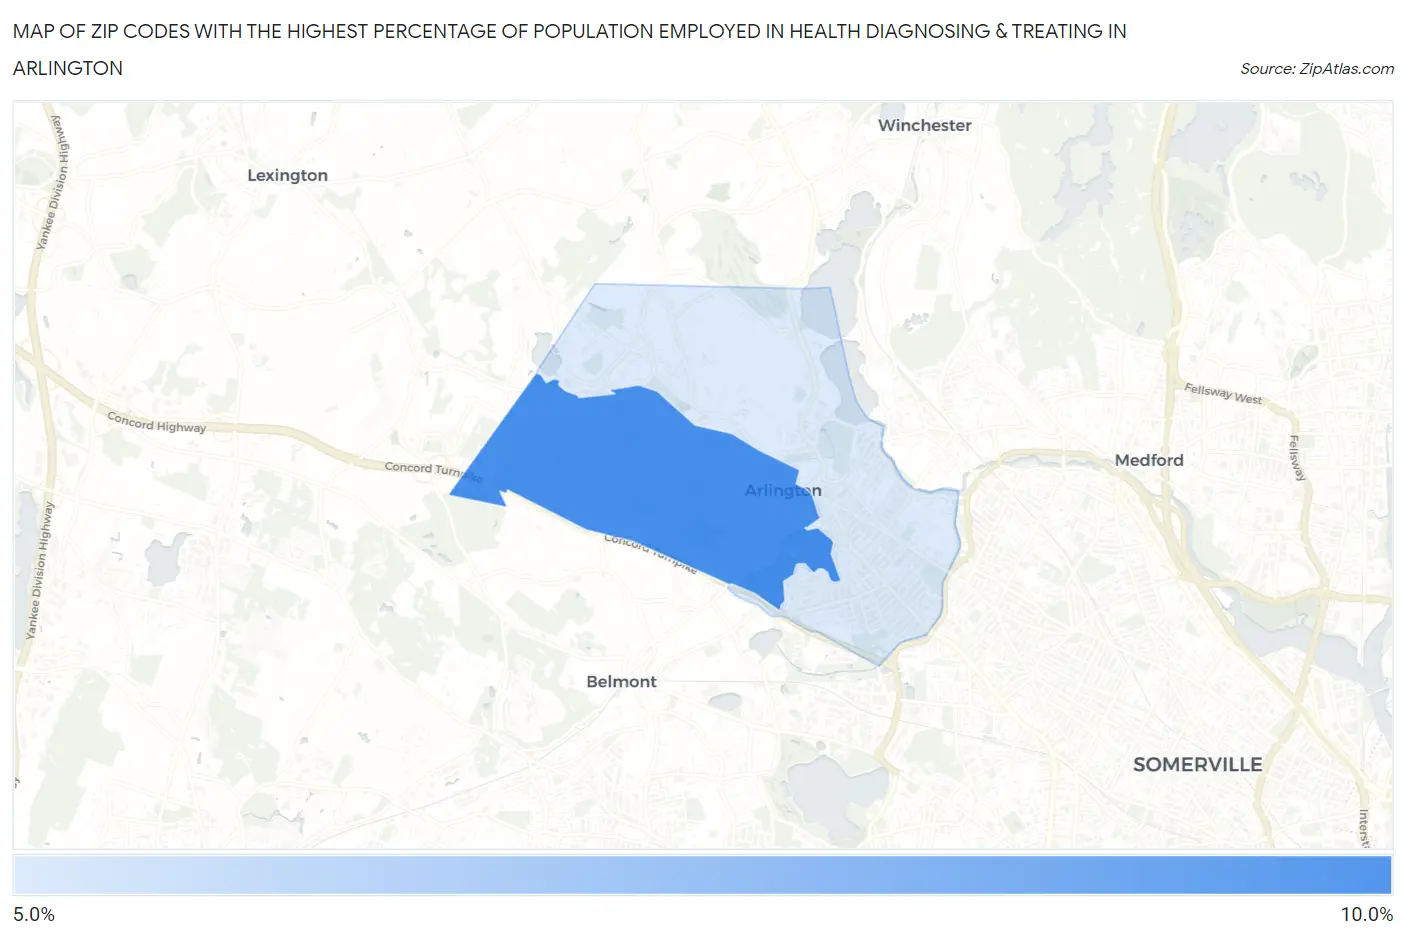
Map of Zip Codes with the Highest Percentage of Population Employed in Health Diagnosing & Treating in Arlington
5.7%
9.1%
Zip Codes with the Highest Percentage of Population Employed in Health Diagnosing & Treating in Arlington, MA
| Zip Code | % Employed | vs State | vs National | |
| 1. | 02476 | 9.1% | 6.9%(+2.16)#119 | 6.2%(+2.82)#5,252 |
| 2. | 02474 | 5.7% | 6.9%(-1.20)#354 | 6.2%(-0.545)#14,996 |
1
Common Questions
What are the Top Zip Codes with the Highest Percentage of Population Employed in Health Diagnosing & Treating in Arlington, MA?
Top Zip Codes with the Highest Percentage of Population Employed in Health Diagnosing & Treating in Arlington, MA are:
What zip code has the Highest Percentage of Population Employed in Health Diagnosing & Treating in Arlington, MA?
02476 has the Highest Percentage of Population Employed in Health Diagnosing & Treating in Arlington, MA with 9.1%.
What is the Percentage of Population Employed in Health Diagnosing & Treating in Arlington, MA?
Percentage of Population Employed in Health Diagnosing & Treating in Arlington is 6.9%.
What is the Percentage of Population Employed in Health Diagnosing & Treating in Massachusetts?
Percentage of Population Employed in Health Diagnosing & Treating in Massachusetts is 6.9%.
What is the Percentage of Population Employed in Health Diagnosing & Treating in the United States?
Percentage of Population Employed in Health Diagnosing & Treating in the United States is 6.2%.