Zip Codes with the Highest Percentage of Population Employed in Professional & Scientific Services in Topeka, KS
RELATED REPORTS & OPTIONS
Professional & Scientific Services
Topeka
Compare Zip Codes
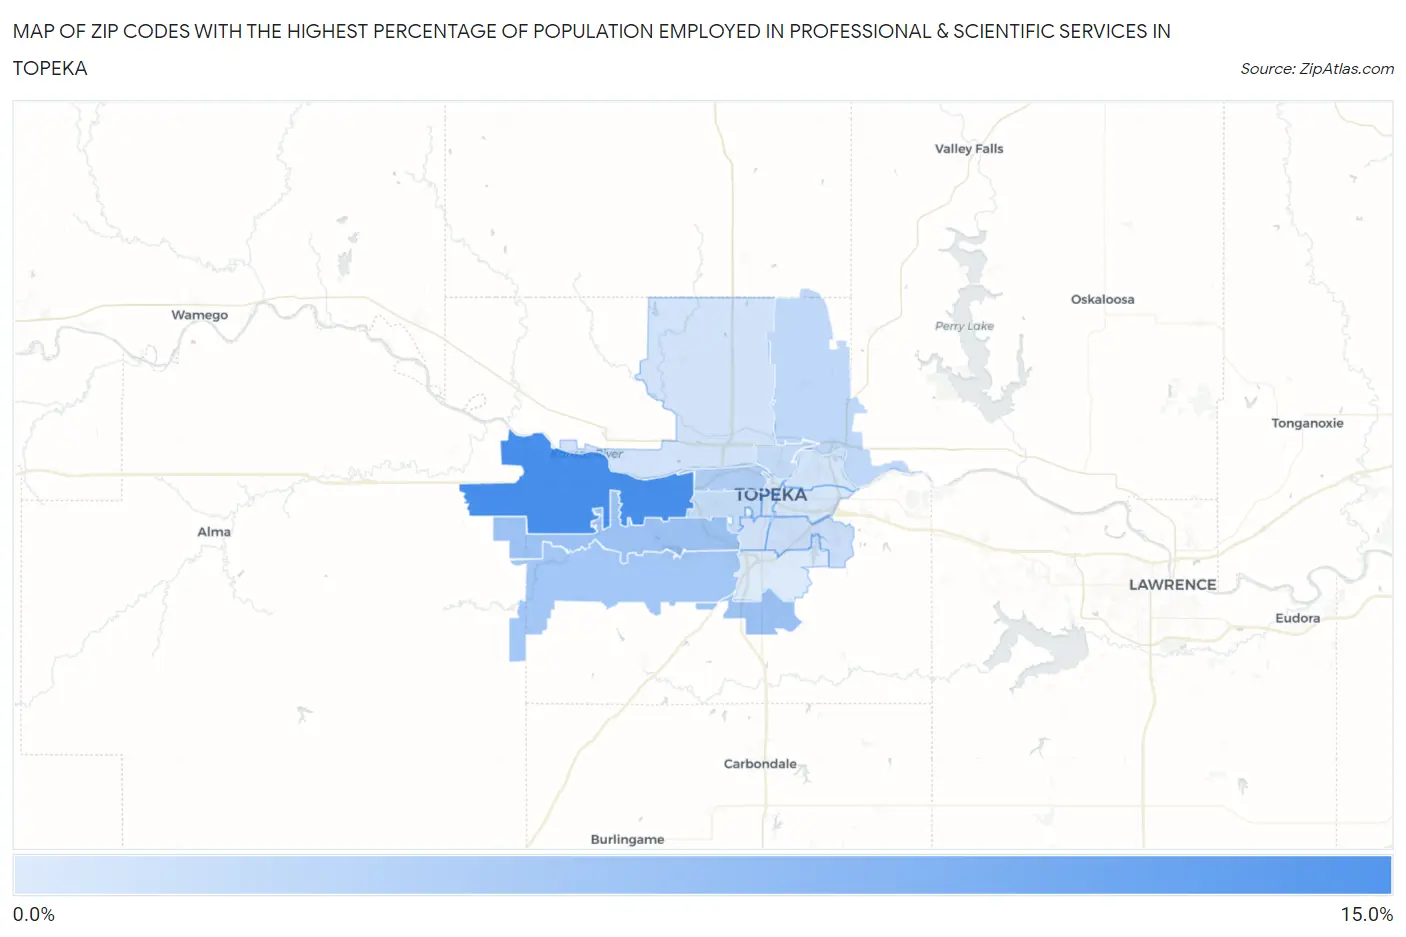
Map of Zip Codes with the Highest Percentage of Population Employed in Professional & Scientific Services in Topeka
0.0%
15.0%
Zip Codes with the Highest Percentage of Population Employed in Professional & Scientific Services in Topeka, KS
| Zip Code | % Employed | vs State | vs National | |
| 1. | 66615 | 13.1% | 6.5%(+6.59)#31 | 7.8%(+5.27)#2,663 |
| 2. | 66619 | 6.7% | 6.5%(+0.143)#104 | 7.8%(-1.18)#8,705 |
| 3. | 66614 | 6.4% | 6.5%(-0.094)#110 | 7.8%(-1.41)#9,147 |
| 4. | 66610 | 6.0% | 6.5%(-0.489)#122 | 7.8%(-1.81)#9,907 |
| 5. | 66606 | 5.1% | 6.5%(-1.39)#156 | 7.8%(-2.70)#11,962 |
| 6. | 66617 | 4.0% | 6.5%(-2.56)#215 | 7.8%(-3.88)#15,212 |
| 7. | 66608 | 3.7% | 6.5%(-2.86)#234 | 7.8%(-4.17)#16,131 |
| 8. | 66604 | 3.4% | 6.5%(-3.16)#258 | 7.8%(-4.48)#17,165 |
| 9. | 66605 | 3.0% | 6.5%(-3.48)#282 | 7.8%(-4.80)#18,284 |
| 10. | 66612 | 2.9% | 6.5%(-3.61)#287 | 7.8%(-4.93)#18,706 |
| 11. | 66611 | 2.6% | 6.5%(-3.93)#321 | 7.8%(-5.25)#19,844 |
| 12. | 66618 | 2.5% | 6.5%(-3.98)#325 | 7.8%(-5.30)#20,006 |
| 13. | 66616 | 2.4% | 6.5%(-4.15)#344 | 7.8%(-5.46)#20,606 |
| 14. | 66603 | 2.4% | 6.5%(-4.16)#345 | 7.8%(-5.48)#20,667 |
| 15. | 66607 | 2.3% | 6.5%(-4.20)#351 | 7.8%(-5.52)#20,797 |
| 16. | 66609 | 1.8% | 6.5%(-4.76)#391 | 7.8%(-6.08)#22,666 |
1
Common Questions
What are the Top 10 Zip Codes with the Highest Percentage of Population Employed in Professional & Scientific Services in Topeka, KS?
Top 10 Zip Codes with the Highest Percentage of Population Employed in Professional & Scientific Services in Topeka, KS are:
What zip code has the Highest Percentage of Population Employed in Professional & Scientific Services in Topeka, KS?
66615 has the Highest Percentage of Population Employed in Professional & Scientific Services in Topeka, KS with 13.1%.
What is the Percentage of Population Employed in Professional & Scientific Services in Topeka, KS?
Percentage of Population Employed in Professional & Scientific Services in Topeka is 3.9%.
What is the Percentage of Population Employed in Professional & Scientific Services in Kansas?
Percentage of Population Employed in Professional & Scientific Services in Kansas is 6.5%.
What is the Percentage of Population Employed in Professional & Scientific Services in the United States?
Percentage of Population Employed in Professional & Scientific Services in the United States is 7.8%.