Zip Codes with the Highest Percentage of Black / African American Population in Topeka, KS
RELATED REPORTS & OPTIONS
Black / African American
Topeka
Compare Zip Codes
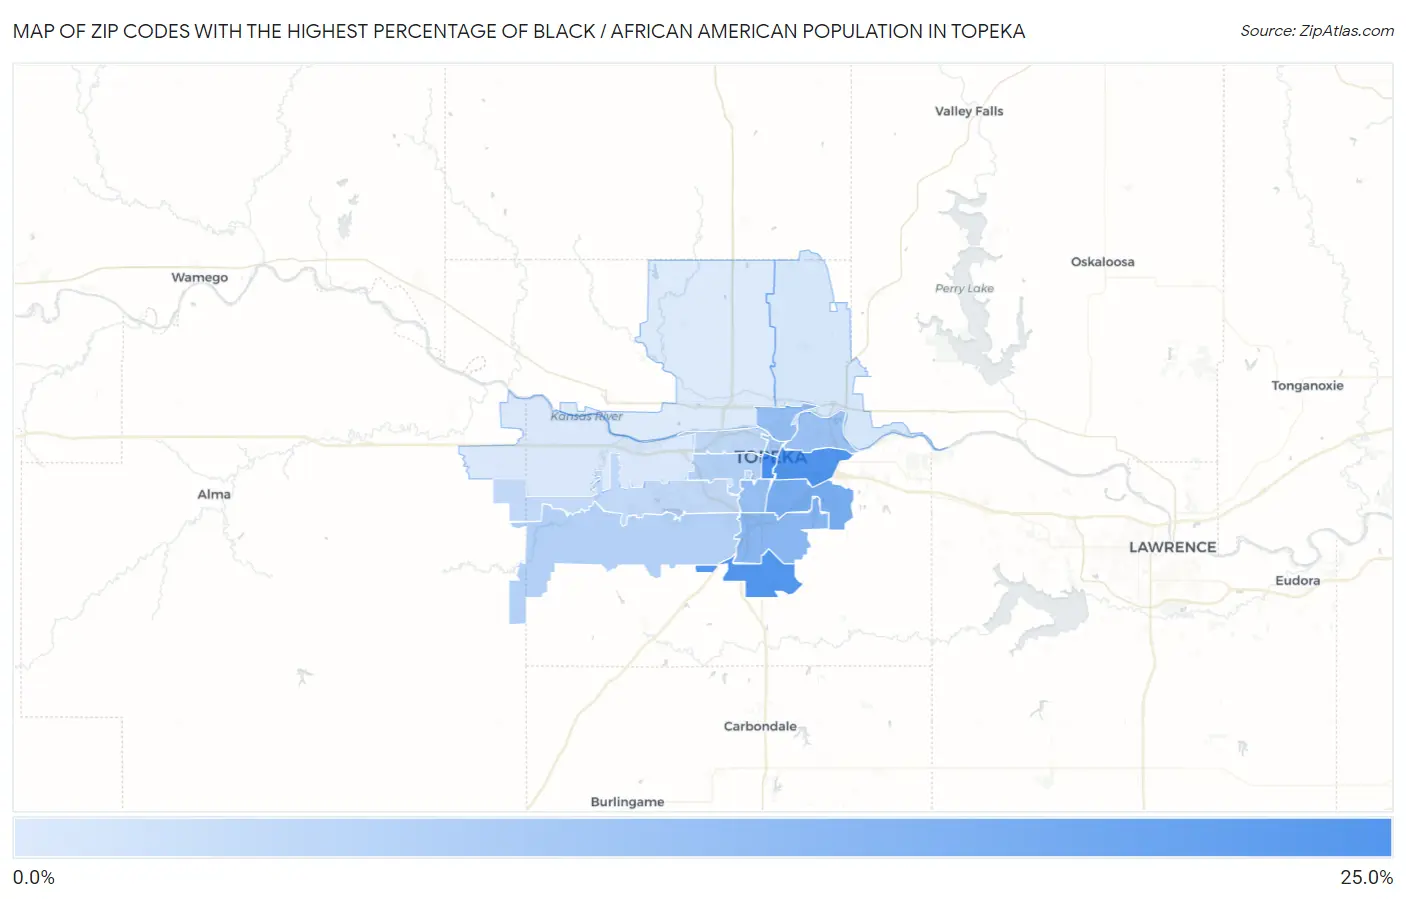
Map of Zip Codes with the Highest Percentage of Black / African American Population in Topeka
0.85%
23.0%
Zip Codes with the Highest Percentage of Black / African American Population in Topeka, KS
| Zip Code | Black / African American | vs State | vs National | |
| 1. | 66612 | 23.0% | 5.6%(+17.4)#8 | 12.5%(+10.5)#3,487 |
| 2. | 66607 | 21.8% | 5.6%(+16.2)#13 | 12.5%(+9.28)#3,675 |
| 3. | 66619 | 21.0% | 5.6%(+15.5)#16 | 12.5%(+8.56)#3,783 |
| 4. | 66605 | 15.4% | 5.6%(+9.84)#21 | 12.5%(+2.94)#4,849 |
| 5. | 66609 | 12.6% | 5.6%(+6.99)#29 | 12.5%(+0.092)#5,682 |
| 6. | 66608 | 11.1% | 5.6%(+5.53)#33 | 12.5%(-1.37)#6,202 |
| 7. | 66611 | 10.7% | 5.6%(+5.13)#34 | 12.5%(-1.77)#6,355 |
| 8. | 66616 | 10.3% | 5.6%(+4.72)#37 | 12.5%(-2.18)#6,510 |
| 9. | 66603 | 8.9% | 5.6%(+3.32)#41 | 12.5%(-3.58)#7,081 |
| 10. | 66604 | 6.6% | 5.6%(+1.07)#57 | 12.5%(-5.83)#8,321 |
| 11. | 66610 | 6.5% | 5.6%(+0.926)#58 | 12.5%(-5.97)#8,409 |
| 12. | 66606 | 5.0% | 5.6%(-0.528)#77 | 12.5%(-7.43)#9,520 |
| 13. | 66614 | 4.5% | 5.6%(-1.04)#84 | 12.5%(-7.94)#9,995 |
| 14. | 66621 | 3.8% | 5.6%(-1.76)#96 | 12.5%(-8.66)#10,712 |
| 15. | 66622 | 2.0% | 5.6%(-3.53)#152 | 12.5%(-10.4)#13,489 |
| 16. | 66617 | 1.7% | 5.6%(-3.83)#166 | 12.5%(-10.7)#14,178 |
| 17. | 66615 | 1.3% | 5.6%(-4.26)#192 | 12.5%(-11.2)#15,392 |
| 18. | 66618 | 0.85% | 5.6%(-4.72)#233 | 12.5%(-11.6)#17,162 |
1
Common Questions
What are the Top 10 Zip Codes with the Highest Percentage of Black / African American Population in Topeka, KS?
Top 10 Zip Codes with the Highest Percentage of Black / African American Population in Topeka, KS are:
What zip code has the Highest Percentage of Black / African American Population in Topeka, KS?
66612 has the Highest Percentage of Black / African American Population in Topeka, KS with 23.0%.
What is the Percentage of Black / African American Population in Topeka, KS?
Percentage of Black / African American Population in Topeka is 10.2%.
What is the Percentage of Black / African American Population in Kansas?
Percentage of Black / African American Population in Kansas is 5.6%.
What is the Percentage of Black / African American Population in the United States?
Percentage of Black / African American Population in the United States is 12.5%.