White/Caucasian vs European Median Male Earnings
COMPARE
White/Caucasian
European
Median Male Earnings
Median Male Earnings Comparison
Whites/Caucasians
Europeans
$53,925
MEDIAN MALE EARNINGS
36.5/ 100
METRIC RATING
184th/ 347
METRIC RANK
$57,637
MEDIAN MALE EARNINGS
95.6/ 100
METRIC RATING
111th/ 347
METRIC RANK
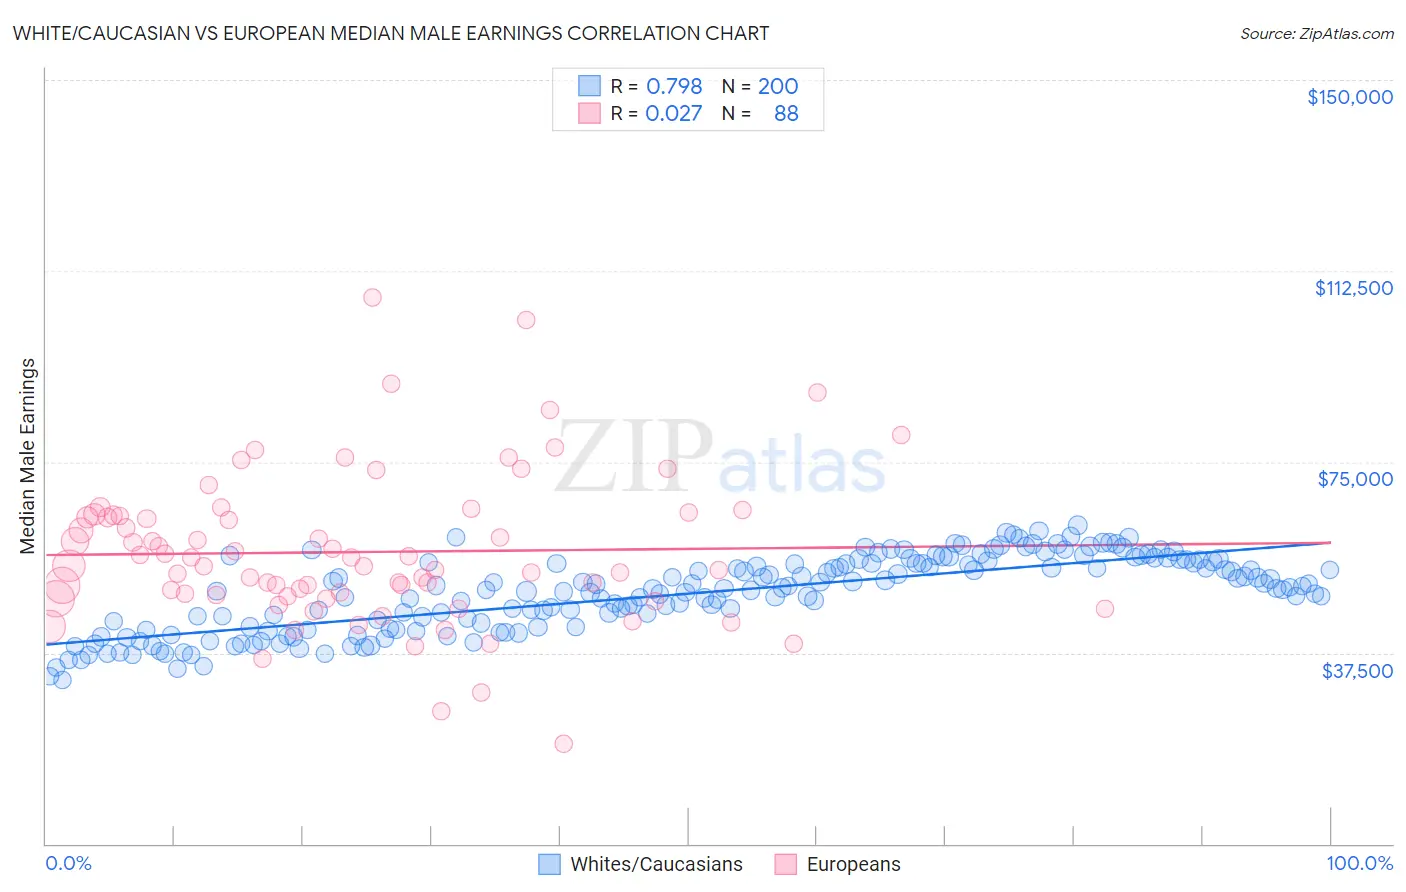
White/Caucasian vs European Median Male Earnings Correlation Chart
The statistical analysis conducted on geographies consisting of 582,594,178 people shows a strong positive correlation between the proportion of Whites/Caucasians and median male earnings in the United States with a correlation coefficient (R) of 0.798 and weighted average of $53,925. Similarly, the statistical analysis conducted on geographies consisting of 560,846,229 people shows no correlation between the proportion of Europeans and median male earnings in the United States with a correlation coefficient (R) of 0.027 and weighted average of $57,637, a difference of 6.9%.
Median Male Earnings Correlation Summary
| Measurement | White/Caucasian | European |
| Minimum | $32,128 | $19,583 |
| Maximum | $62,517 | $107,377 |
| Range | $30,389 | $87,794 |
| Mean | $49,142 | $57,294 |
| Median | $50,057 | $54,588 |
| Interquartile 25% (IQ1) | $42,596 | $48,703 |
| Interquartile 75% (IQ3) | $55,134 | $64,440 |
| Interquartile Range (IQR) | $12,539 | $15,737 |
| Standard Deviation (Sample) | $7,259 | $14,840 |
| Standard Deviation (Population) | $7,240 | $14,755 |
Similar Demographics by Median Male Earnings
Demographics Similar to Whites/Caucasians by Median Male Earnings
In terms of median male earnings, the demographic groups most similar to Whites/Caucasians are Immigrants from Sierra Leone ($53,905, a difference of 0.040%), Immigrants from South America ($53,962, a difference of 0.070%), Yugoslavian ($53,967, a difference of 0.080%), Colombian ($53,832, a difference of 0.17%), and Immigrants from Eritrea ($53,715, a difference of 0.39%).
| Demographics | Rating | Rank | Median Male Earnings |
| Costa Ricans | 44.8 /100 | #177 | Average $54,279 |
| Sierra Leoneans | 44.8 /100 | #178 | Average $54,279 |
| Celtics | 43.9 /100 | #179 | Average $54,242 |
| Iraqis | 42.5 /100 | #180 | Average $54,182 |
| Immigrants | Immigrants | 42.1 /100 | #181 | Average $54,168 |
| Yugoslavians | 37.4 /100 | #182 | Fair $53,967 |
| Immigrants | South America | 37.3 /100 | #183 | Fair $53,962 |
| Whites/Caucasians | 36.5 /100 | #184 | Fair $53,925 |
| Immigrants | Sierra Leone | 36.0 /100 | #185 | Fair $53,905 |
| Colombians | 34.4 /100 | #186 | Fair $53,832 |
| Immigrants | Eritrea | 31.8 /100 | #187 | Fair $53,715 |
| Immigrants | Eastern Africa | 31.8 /100 | #188 | Fair $53,713 |
| Puget Sound Salish | 31.6 /100 | #189 | Fair $53,704 |
| Uruguayans | 31.1 /100 | #190 | Fair $53,680 |
| Guamanians/Chamorros | 30.7 /100 | #191 | Fair $53,661 |
Demographics Similar to Europeans by Median Male Earnings
In terms of median male earnings, the demographic groups most similar to Europeans are Immigrants from Afghanistan ($57,582, a difference of 0.090%), Carpatho Rusyn ($57,572, a difference of 0.11%), Immigrants from Kuwait ($57,562, a difference of 0.13%), Palestinian ($57,778, a difference of 0.25%), and Swedish ($57,445, a difference of 0.33%).
| Demographics | Rating | Rank | Median Male Earnings |
| Armenians | 97.3 /100 | #104 | Exceptional $58,134 |
| Immigrants | Western Asia | 97.3 /100 | #105 | Exceptional $58,131 |
| Immigrants | Northern Africa | 96.9 /100 | #106 | Exceptional $58,008 |
| Serbians | 96.8 /100 | #107 | Exceptional $57,975 |
| Immigrants | Uzbekistan | 96.7 /100 | #108 | Exceptional $57,941 |
| British | 96.5 /100 | #109 | Exceptional $57,890 |
| Palestinians | 96.2 /100 | #110 | Exceptional $57,778 |
| Europeans | 95.6 /100 | #111 | Exceptional $57,637 |
| Immigrants | Afghanistan | 95.4 /100 | #112 | Exceptional $57,582 |
| Carpatho Rusyns | 95.3 /100 | #113 | Exceptional $57,572 |
| Immigrants | Kuwait | 95.3 /100 | #114 | Exceptional $57,562 |
| Swedes | 94.8 /100 | #115 | Exceptional $57,445 |
| Lebanese | 94.6 /100 | #116 | Exceptional $57,409 |
| Immigrants | Zimbabwe | 94.3 /100 | #117 | Exceptional $57,352 |
| Hungarians | 94.0 /100 | #118 | Exceptional $57,309 |