Immigrants from Brazil vs European Median Male Earnings
COMPARE
Immigrants from Brazil
European
Median Male Earnings
Median Male Earnings Comparison
Immigrants from Brazil
Europeans
$58,324
MEDIAN MALE EARNINGS
97.7/ 100
METRIC RATING
101st/ 347
METRIC RANK
$57,637
MEDIAN MALE EARNINGS
95.6/ 100
METRIC RATING
111th/ 347
METRIC RANK
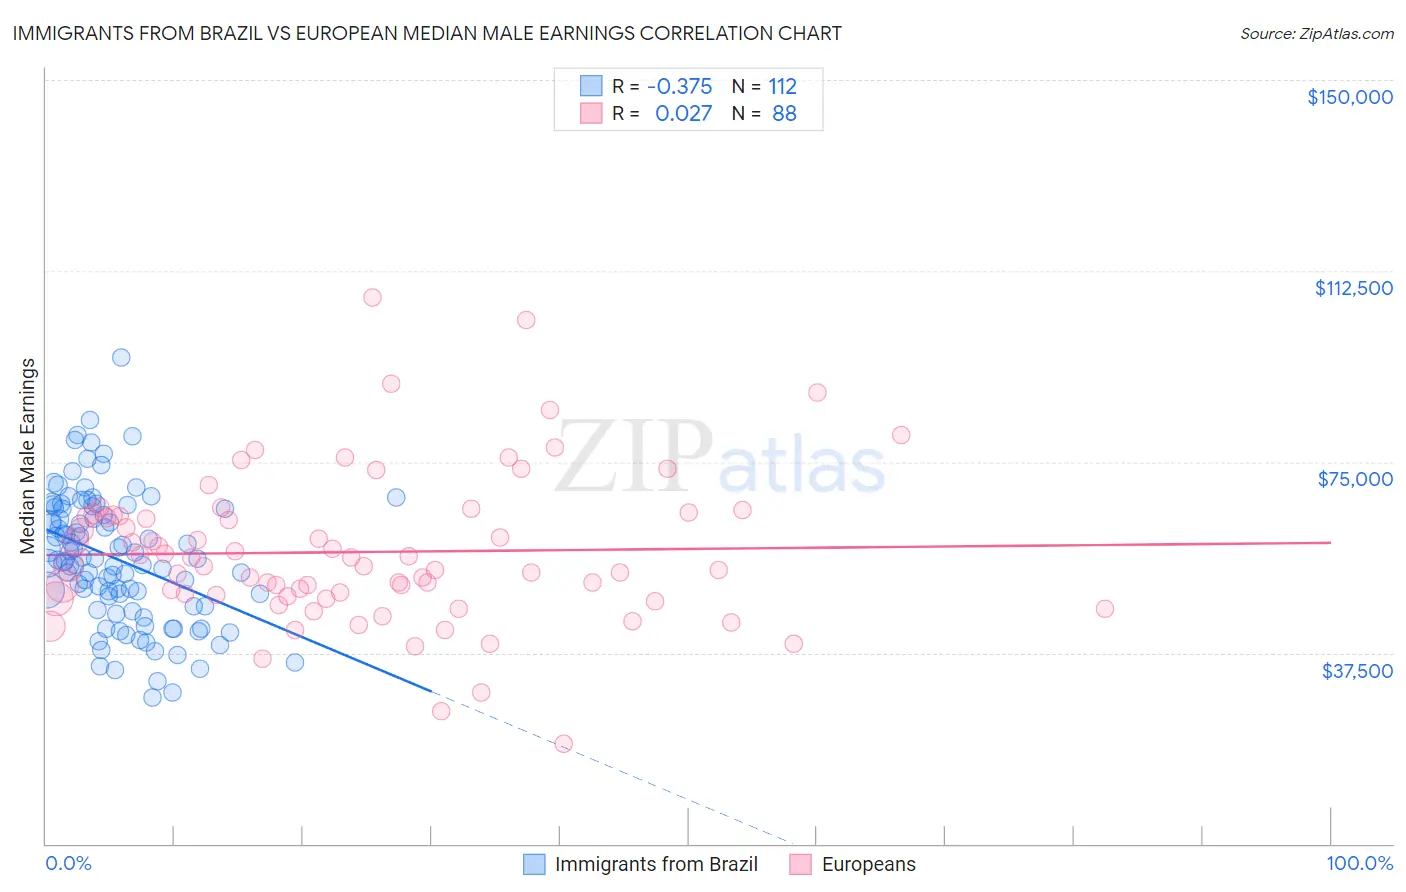
Immigrants from Brazil vs European Median Male Earnings Correlation Chart
The statistical analysis conducted on geographies consisting of 342,925,188 people shows a mild negative correlation between the proportion of Immigrants from Brazil and median male earnings in the United States with a correlation coefficient (R) of -0.375 and weighted average of $58,324. Similarly, the statistical analysis conducted on geographies consisting of 560,846,229 people shows no correlation between the proportion of Europeans and median male earnings in the United States with a correlation coefficient (R) of 0.027 and weighted average of $57,637, a difference of 1.2%.
Median Male Earnings Correlation Summary
| Measurement | Immigrants from Brazil | European |
| Minimum | $28,750 | $19,583 |
| Maximum | $95,391 | $107,377 |
| Range | $66,641 | $87,794 |
| Mean | $55,921 | $57,294 |
| Median | $55,594 | $54,588 |
| Interquartile 25% (IQ1) | $46,610 | $48,703 |
| Interquartile 75% (IQ3) | $65,884 | $64,440 |
| Interquartile Range (IQR) | $19,274 | $15,737 |
| Standard Deviation (Sample) | $12,788 | $14,840 |
| Standard Deviation (Population) | $12,730 | $14,755 |
Demographics Similar to Immigrants from Brazil and Europeans by Median Male Earnings
In terms of median male earnings, the demographic groups most similar to Immigrants from Brazil are Assyrian/Chaldean/Syriac ($58,437, a difference of 0.19%), Immigrants from Poland ($58,452, a difference of 0.22%), Syrian ($58,187, a difference of 0.24%), Jordanian ($58,500, a difference of 0.30%), and Polish ($58,139, a difference of 0.32%). Similarly, the demographic groups most similar to Europeans are Immigrants from Afghanistan ($57,582, a difference of 0.090%), Carpatho Rusyn ($57,572, a difference of 0.11%), Immigrants from Kuwait ($57,562, a difference of 0.13%), Palestinian ($57,778, a difference of 0.25%), and Swedish ($57,445, a difference of 0.33%).
| Demographics | Rating | Rank | Median Male Earnings |
| Albanians | 98.4 /100 | #96 | Exceptional $58,680 |
| Northern Europeans | 98.2 /100 | #97 | Exceptional $58,588 |
| Jordanians | 98.1 /100 | #98 | Exceptional $58,500 |
| Immigrants | Poland | 98.0 /100 | #99 | Exceptional $58,452 |
| Assyrians/Chaldeans/Syriacs | 97.9 /100 | #100 | Exceptional $58,437 |
| Immigrants | Brazil | 97.7 /100 | #101 | Exceptional $58,324 |
| Syrians | 97.4 /100 | #102 | Exceptional $58,187 |
| Poles | 97.3 /100 | #103 | Exceptional $58,139 |
| Armenians | 97.3 /100 | #104 | Exceptional $58,134 |
| Immigrants | Western Asia | 97.3 /100 | #105 | Exceptional $58,131 |
| Immigrants | Northern Africa | 96.9 /100 | #106 | Exceptional $58,008 |
| Serbians | 96.8 /100 | #107 | Exceptional $57,975 |
| Immigrants | Uzbekistan | 96.7 /100 | #108 | Exceptional $57,941 |
| British | 96.5 /100 | #109 | Exceptional $57,890 |
| Palestinians | 96.2 /100 | #110 | Exceptional $57,778 |
| Europeans | 95.6 /100 | #111 | Exceptional $57,637 |
| Immigrants | Afghanistan | 95.4 /100 | #112 | Exceptional $57,582 |
| Carpatho Rusyns | 95.3 /100 | #113 | Exceptional $57,572 |
| Immigrants | Kuwait | 95.3 /100 | #114 | Exceptional $57,562 |
| Swedes | 94.8 /100 | #115 | Exceptional $57,445 |
| Lebanese | 94.6 /100 | #116 | Exceptional $57,409 |