White/Caucasian vs European Median Female Earnings
COMPARE
White/Caucasian
European
Median Female Earnings
Median Female Earnings Comparison
Whites/Caucasians
Europeans
$37,531
MEDIAN FEMALE EARNINGS
1.1/ 100
METRIC RATING
254th/ 347
METRIC RANK
$39,457
MEDIAN FEMALE EARNINGS
37.7/ 100
METRIC RATING
184th/ 347
METRIC RANK
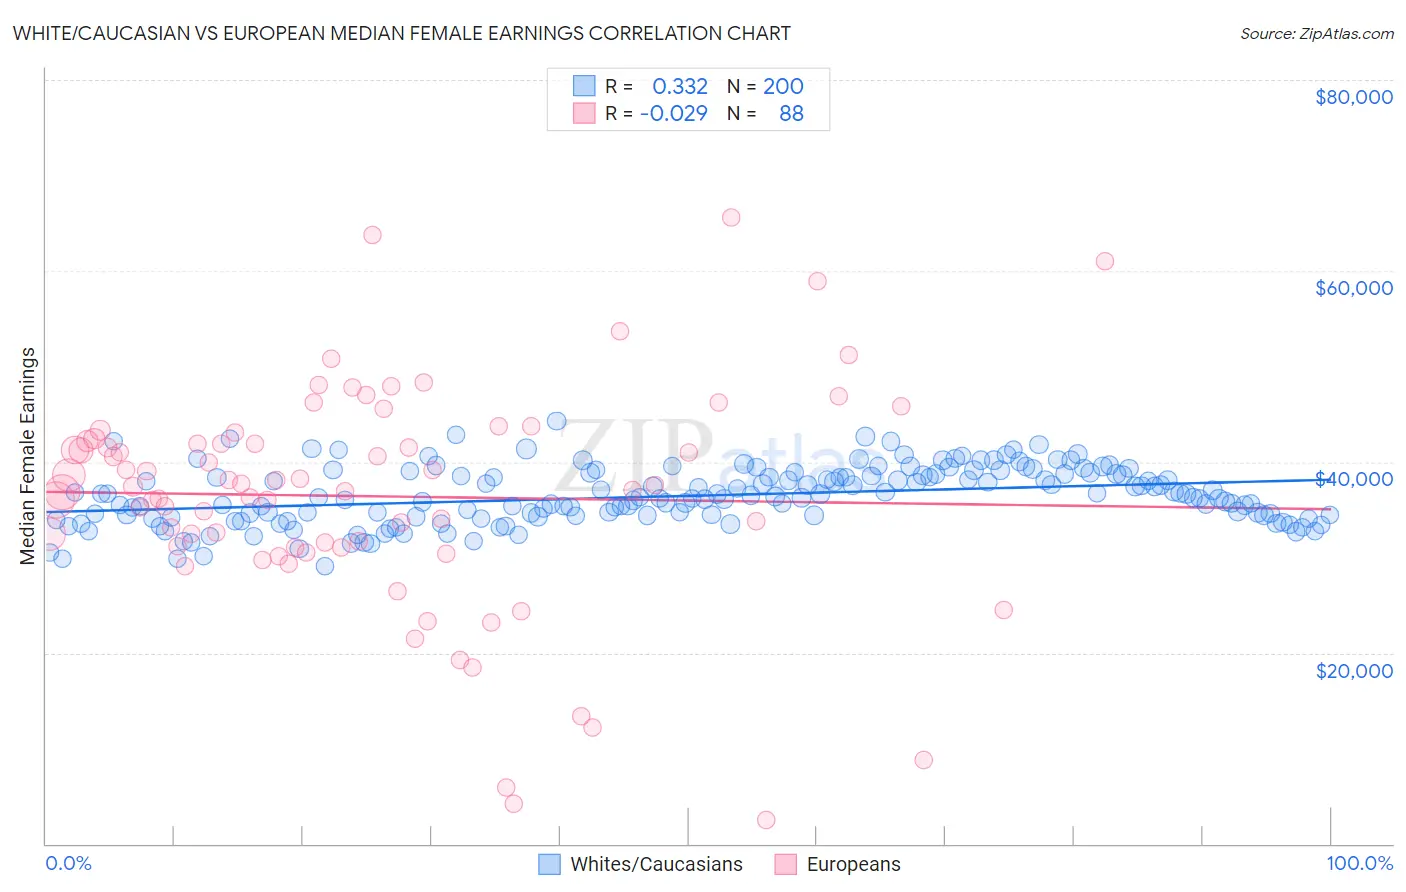
White/Caucasian vs European Median Female Earnings Correlation Chart
The statistical analysis conducted on geographies consisting of 581,839,033 people shows a mild positive correlation between the proportion of Whites/Caucasians and median female earnings in the United States with a correlation coefficient (R) of 0.332 and weighted average of $37,531. Similarly, the statistical analysis conducted on geographies consisting of 560,435,865 people shows no correlation between the proportion of Europeans and median female earnings in the United States with a correlation coefficient (R) of -0.029 and weighted average of $39,457, a difference of 5.1%.
Median Female Earnings Correlation Summary
| Measurement | White/Caucasian | European |
| Minimum | $29,061 | $2,499 |
| Maximum | $44,249 | $65,560 |
| Range | $15,187 | $63,061 |
| Mean | $36,445 | $36,392 |
| Median | $36,298 | $37,518 |
| Interquartile 25% (IQ1) | $34,375 | $31,126 |
| Interquartile 75% (IQ3) | $38,681 | $42,307 |
| Interquartile Range (IQR) | $4,306 | $11,181 |
| Standard Deviation (Sample) | $2,956 | $11,839 |
| Standard Deviation (Population) | $2,949 | $11,771 |
Similar Demographics by Median Female Earnings
Demographics Similar to Whites/Caucasians by Median Female Earnings
In terms of median female earnings, the demographic groups most similar to Whites/Caucasians are Colville ($37,514, a difference of 0.040%), Samoan ($37,498, a difference of 0.090%), Hawaiian ($37,497, a difference of 0.090%), Belizean ($37,429, a difference of 0.27%), and Scotch-Irish ($37,383, a difference of 0.39%).
| Demographics | Rating | Rank | Median Female Earnings |
| Immigrants | Somalia | 2.4 /100 | #247 | Tragic $37,914 |
| Alaskan Athabascans | 2.3 /100 | #248 | Tragic $37,905 |
| Swiss | 2.3 /100 | #249 | Tragic $37,904 |
| Immigrants | Iraq | 2.2 /100 | #250 | Tragic $37,864 |
| Welsh | 2.1 /100 | #251 | Tragic $37,856 |
| Immigrants | Dominica | 2.0 /100 | #252 | Tragic $37,825 |
| Danes | 1.6 /100 | #253 | Tragic $37,730 |
| Whites/Caucasians | 1.1 /100 | #254 | Tragic $37,531 |
| Colville | 1.1 /100 | #255 | Tragic $37,514 |
| Samoans | 1.0 /100 | #256 | Tragic $37,498 |
| Hawaiians | 1.0 /100 | #257 | Tragic $37,497 |
| Belizeans | 0.9 /100 | #258 | Tragic $37,429 |
| Scotch-Irish | 0.8 /100 | #259 | Tragic $37,383 |
| Dutch | 0.7 /100 | #260 | Tragic $37,339 |
| Malaysians | 0.7 /100 | #261 | Tragic $37,298 |
Demographics Similar to Europeans by Median Female Earnings
In terms of median female earnings, the demographic groups most similar to Europeans are Immigrants from West Indies ($39,441, a difference of 0.040%), Colombian ($39,439, a difference of 0.040%), Swedish ($39,421, a difference of 0.090%), Bermudan ($39,418, a difference of 0.10%), and Hungarian ($39,510, a difference of 0.13%).
| Demographics | Rating | Rank | Median Female Earnings |
| Costa Ricans | 46.1 /100 | #177 | Average $39,622 |
| Slavs | 45.6 /100 | #178 | Average $39,613 |
| Immigrants | Germany | 45.1 /100 | #179 | Average $39,603 |
| Immigrants | Kenya | 41.6 /100 | #180 | Average $39,535 |
| Tsimshian | 41.4 /100 | #181 | Average $39,530 |
| Tlingit-Haida | 40.5 /100 | #182 | Average $39,513 |
| Hungarians | 40.3 /100 | #183 | Average $39,510 |
| Europeans | 37.7 /100 | #184 | Fair $39,457 |
| Immigrants | West Indies | 36.9 /100 | #185 | Fair $39,441 |
| Colombians | 36.9 /100 | #186 | Fair $39,439 |
| Swedes | 36.0 /100 | #187 | Fair $39,421 |
| Bermudans | 35.9 /100 | #188 | Fair $39,418 |
| Senegalese | 34.2 /100 | #189 | Fair $39,384 |
| Puget Sound Salish | 33.9 /100 | #190 | Fair $39,376 |
| Immigrants | Western Africa | 32.7 /100 | #191 | Fair $39,351 |