White/Caucasian vs Immigrants from Indonesia Median Male Earnings
COMPARE
White/Caucasian
Immigrants from Indonesia
Median Male Earnings
Median Male Earnings Comparison
Whites/Caucasians
Immigrants from Indonesia
$53,925
MEDIAN MALE EARNINGS
36.5/ 100
METRIC RATING
184th/ 347
METRIC RANK
$60,935
MEDIAN MALE EARNINGS
99.8/ 100
METRIC RATING
65th/ 347
METRIC RANK
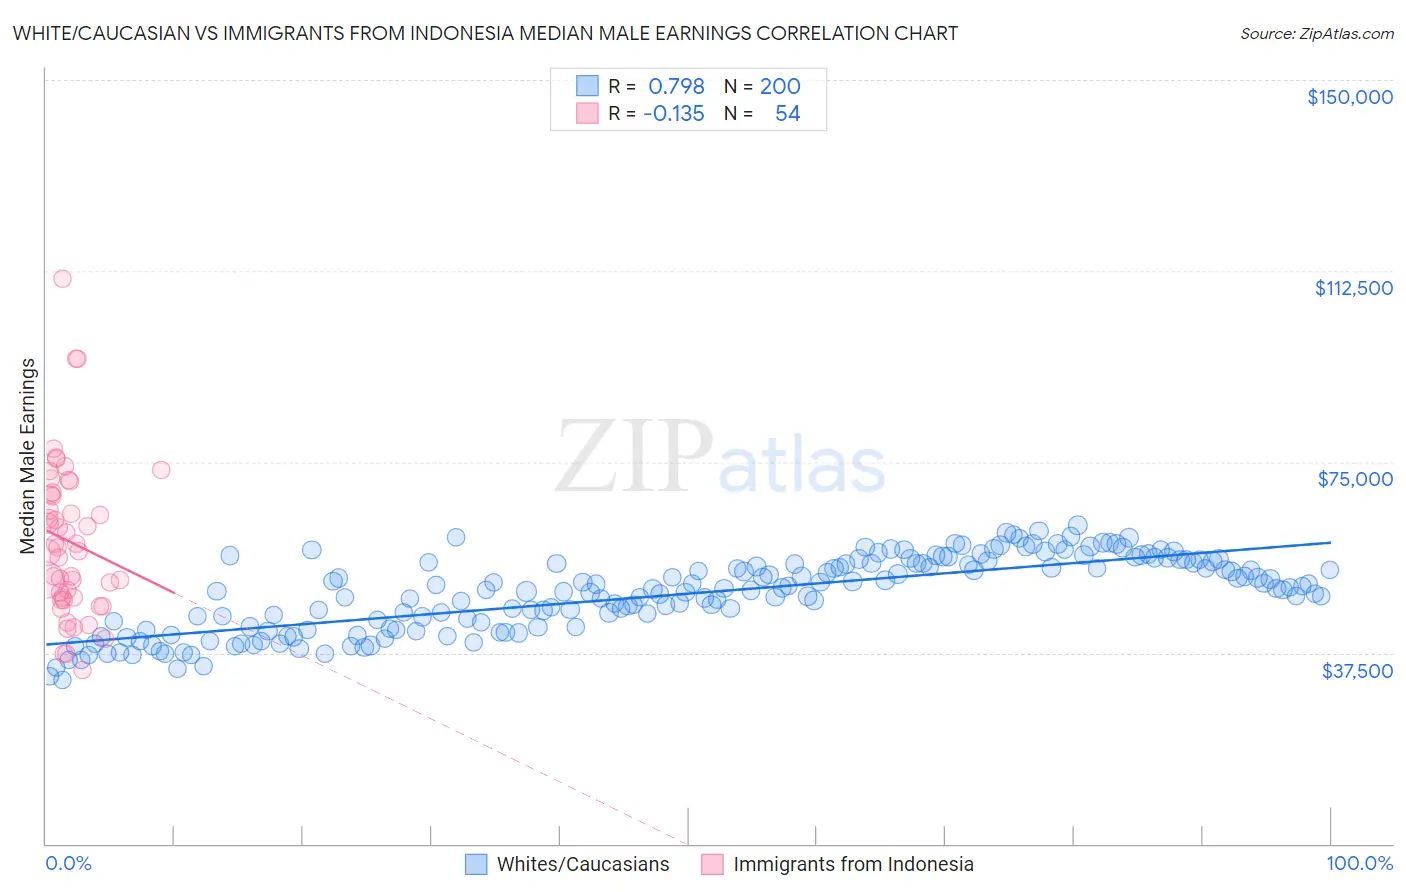
White/Caucasian vs Immigrants from Indonesia Median Male Earnings Correlation Chart
The statistical analysis conducted on geographies consisting of 582,594,178 people shows a strong positive correlation between the proportion of Whites/Caucasians and median male earnings in the United States with a correlation coefficient (R) of 0.798 and weighted average of $53,925. Similarly, the statistical analysis conducted on geographies consisting of 215,756,061 people shows a poor negative correlation between the proportion of Immigrants from Indonesia and median male earnings in the United States with a correlation coefficient (R) of -0.135 and weighted average of $60,935, a difference of 13.0%.
Median Male Earnings Correlation Summary
| Measurement | White/Caucasian | Immigrants from Indonesia |
| Minimum | $32,128 | $34,072 |
| Maximum | $62,517 | $111,048 |
| Range | $30,389 | $76,976 |
| Mean | $49,142 | $59,341 |
| Median | $50,057 | $57,826 |
| Interquartile 25% (IQ1) | $42,596 | $48,312 |
| Interquartile 75% (IQ3) | $55,134 | $68,539 |
| Interquartile Range (IQR) | $12,539 | $20,227 |
| Standard Deviation (Sample) | $7,259 | $15,206 |
| Standard Deviation (Population) | $7,240 | $15,065 |
Similar Demographics by Median Male Earnings
Demographics Similar to Whites/Caucasians by Median Male Earnings
In terms of median male earnings, the demographic groups most similar to Whites/Caucasians are Immigrants from Sierra Leone ($53,905, a difference of 0.040%), Immigrants from South America ($53,962, a difference of 0.070%), Yugoslavian ($53,967, a difference of 0.080%), Colombian ($53,832, a difference of 0.17%), and Immigrants from Eritrea ($53,715, a difference of 0.39%).
| Demographics | Rating | Rank | Median Male Earnings |
| Costa Ricans | 44.8 /100 | #177 | Average $54,279 |
| Sierra Leoneans | 44.8 /100 | #178 | Average $54,279 |
| Celtics | 43.9 /100 | #179 | Average $54,242 |
| Iraqis | 42.5 /100 | #180 | Average $54,182 |
| Immigrants | Immigrants | 42.1 /100 | #181 | Average $54,168 |
| Yugoslavians | 37.4 /100 | #182 | Fair $53,967 |
| Immigrants | South America | 37.3 /100 | #183 | Fair $53,962 |
| Whites/Caucasians | 36.5 /100 | #184 | Fair $53,925 |
| Immigrants | Sierra Leone | 36.0 /100 | #185 | Fair $53,905 |
| Colombians | 34.4 /100 | #186 | Fair $53,832 |
| Immigrants | Eritrea | 31.8 /100 | #187 | Fair $53,715 |
| Immigrants | Eastern Africa | 31.8 /100 | #188 | Fair $53,713 |
| Puget Sound Salish | 31.6 /100 | #189 | Fair $53,704 |
| Uruguayans | 31.1 /100 | #190 | Fair $53,680 |
| Guamanians/Chamorros | 30.7 /100 | #191 | Fair $53,661 |
Demographics Similar to Immigrants from Indonesia by Median Male Earnings
In terms of median male earnings, the demographic groups most similar to Immigrants from Indonesia are Immigrants from Croatia ($60,914, a difference of 0.030%), Immigrants from Eastern Europe ($60,958, a difference of 0.040%), Immigrants from Pakistan ($60,987, a difference of 0.080%), Immigrants from Romania ($61,040, a difference of 0.17%), and Bolivian ($61,066, a difference of 0.21%).
| Demographics | Rating | Rank | Median Male Earnings |
| New Zealanders | 99.9 /100 | #58 | Exceptional $61,199 |
| Immigrants | Netherlands | 99.8 /100 | #59 | Exceptional $61,096 |
| Egyptians | 99.8 /100 | #60 | Exceptional $61,095 |
| Bolivians | 99.8 /100 | #61 | Exceptional $61,066 |
| Immigrants | Romania | 99.8 /100 | #62 | Exceptional $61,040 |
| Immigrants | Pakistan | 99.8 /100 | #63 | Exceptional $60,987 |
| Immigrants | Eastern Europe | 99.8 /100 | #64 | Exceptional $60,958 |
| Immigrants | Indonesia | 99.8 /100 | #65 | Exceptional $60,935 |
| Immigrants | Croatia | 99.8 /100 | #66 | Exceptional $60,914 |
| Immigrants | Spain | 99.8 /100 | #67 | Exceptional $60,750 |
| Immigrants | Serbia | 99.7 /100 | #68 | Exceptional $60,600 |
| Immigrants | Canada | 99.7 /100 | #69 | Exceptional $60,388 |
| Immigrants | Bulgaria | 99.7 /100 | #70 | Exceptional $60,358 |
| Mongolians | 99.7 /100 | #71 | Exceptional $60,350 |
| Immigrants | Western Europe | 99.7 /100 | #72 | Exceptional $60,334 |