White/Caucasian vs Immigrants from Syria Median Male Earnings
COMPARE
White/Caucasian
Immigrants from Syria
Median Male Earnings
Median Male Earnings Comparison
Whites/Caucasians
Immigrants from Syria
$53,925
MEDIAN MALE EARNINGS
36.5/ 100
METRIC RATING
184th/ 347
METRIC RANK
$56,830
MEDIAN MALE EARNINGS
90.8/ 100
METRIC RATING
128th/ 347
METRIC RANK
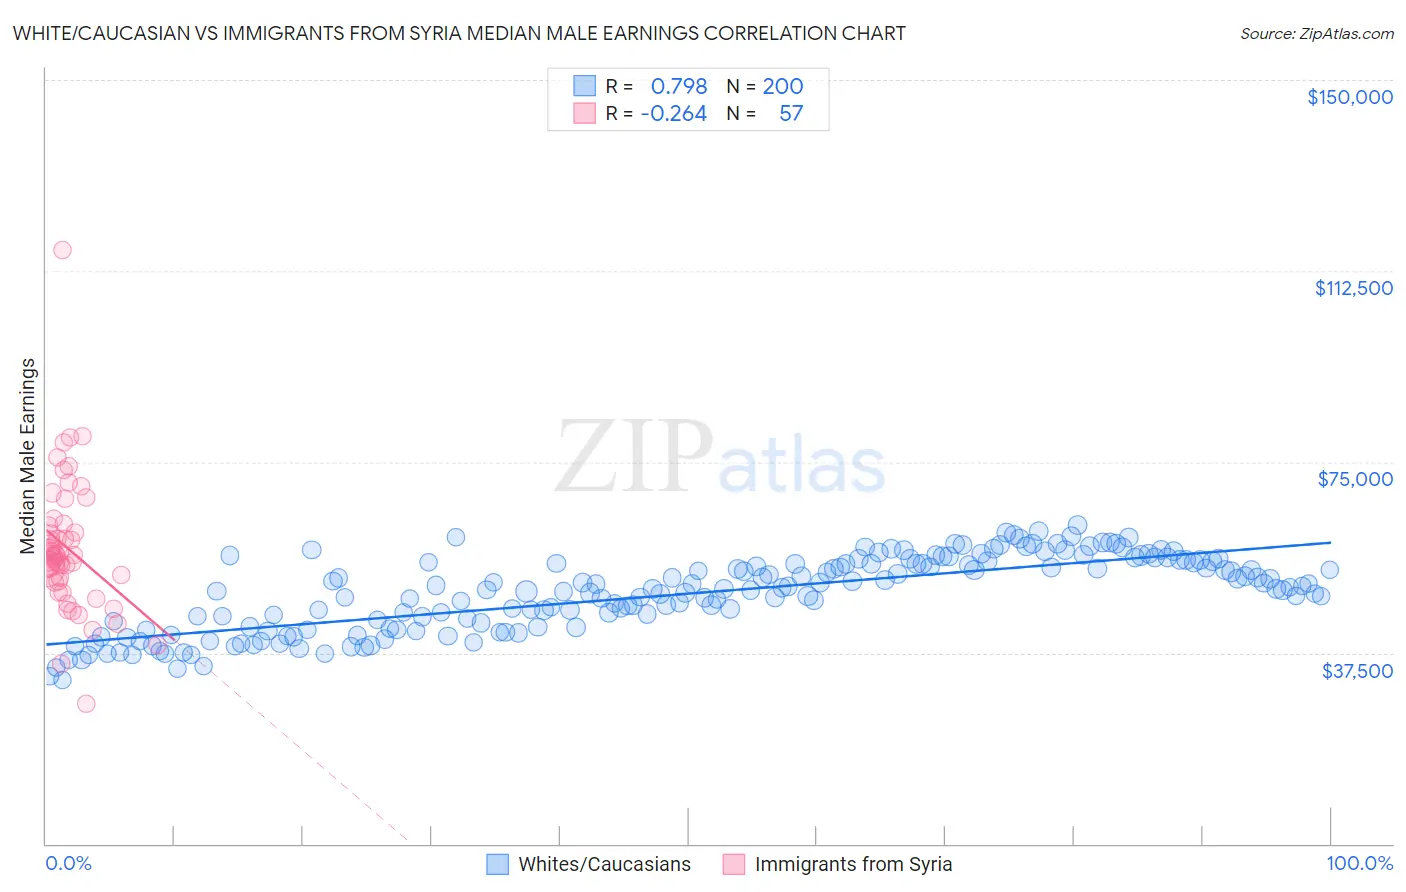
White/Caucasian vs Immigrants from Syria Median Male Earnings Correlation Chart
The statistical analysis conducted on geographies consisting of 582,594,178 people shows a strong positive correlation between the proportion of Whites/Caucasians and median male earnings in the United States with a correlation coefficient (R) of 0.798 and weighted average of $53,925. Similarly, the statistical analysis conducted on geographies consisting of 174,082,936 people shows a weak negative correlation between the proportion of Immigrants from Syria and median male earnings in the United States with a correlation coefficient (R) of -0.264 and weighted average of $56,830, a difference of 5.4%.
Median Male Earnings Correlation Summary
| Measurement | White/Caucasian | Immigrants from Syria |
| Minimum | $32,128 | $27,500 |
| Maximum | $62,517 | $116,543 |
| Range | $30,389 | $89,043 |
| Mean | $49,142 | $58,068 |
| Median | $50,057 | $56,486 |
| Interquartile 25% (IQ1) | $42,596 | $51,463 |
| Interquartile 75% (IQ3) | $55,134 | $62,640 |
| Interquartile Range (IQR) | $12,539 | $11,177 |
| Standard Deviation (Sample) | $7,259 | $13,292 |
| Standard Deviation (Population) | $7,240 | $13,175 |
Similar Demographics by Median Male Earnings
Demographics Similar to Whites/Caucasians by Median Male Earnings
In terms of median male earnings, the demographic groups most similar to Whites/Caucasians are Immigrants from Sierra Leone ($53,905, a difference of 0.040%), Immigrants from South America ($53,962, a difference of 0.070%), Yugoslavian ($53,967, a difference of 0.080%), Colombian ($53,832, a difference of 0.17%), and Immigrants from Eritrea ($53,715, a difference of 0.39%).
| Demographics | Rating | Rank | Median Male Earnings |
| Costa Ricans | 44.8 /100 | #177 | Average $54,279 |
| Sierra Leoneans | 44.8 /100 | #178 | Average $54,279 |
| Celtics | 43.9 /100 | #179 | Average $54,242 |
| Iraqis | 42.5 /100 | #180 | Average $54,182 |
| Immigrants | Immigrants | 42.1 /100 | #181 | Average $54,168 |
| Yugoslavians | 37.4 /100 | #182 | Fair $53,967 |
| Immigrants | South America | 37.3 /100 | #183 | Fair $53,962 |
| Whites/Caucasians | 36.5 /100 | #184 | Fair $53,925 |
| Immigrants | Sierra Leone | 36.0 /100 | #185 | Fair $53,905 |
| Colombians | 34.4 /100 | #186 | Fair $53,832 |
| Immigrants | Eritrea | 31.8 /100 | #187 | Fair $53,715 |
| Immigrants | Eastern Africa | 31.8 /100 | #188 | Fair $53,713 |
| Puget Sound Salish | 31.6 /100 | #189 | Fair $53,704 |
| Uruguayans | 31.1 /100 | #190 | Fair $53,680 |
| Guamanians/Chamorros | 30.7 /100 | #191 | Fair $53,661 |
Demographics Similar to Immigrants from Syria by Median Male Earnings
In terms of median male earnings, the demographic groups most similar to Immigrants from Syria are Brazilian ($56,837, a difference of 0.010%), Chinese ($56,872, a difference of 0.070%), Pakistani ($56,719, a difference of 0.20%), Immigrants from Morocco ($56,958, a difference of 0.23%), and Chilean ($56,973, a difference of 0.25%).
| Demographics | Rating | Rank | Median Male Earnings |
| Immigrants | Albania | 93.3 /100 | #121 | Exceptional $57,179 |
| Immigrants | Jordan | 93.1 /100 | #122 | Exceptional $57,145 |
| Slovenes | 93.1 /100 | #123 | Exceptional $57,145 |
| Chileans | 91.9 /100 | #124 | Exceptional $56,973 |
| Immigrants | Morocco | 91.8 /100 | #125 | Exceptional $56,958 |
| Chinese | 91.1 /100 | #126 | Exceptional $56,872 |
| Brazilians | 90.9 /100 | #127 | Exceptional $56,837 |
| Immigrants | Syria | 90.8 /100 | #128 | Exceptional $56,830 |
| Pakistanis | 89.9 /100 | #129 | Excellent $56,719 |
| Koreans | 89.4 /100 | #130 | Excellent $56,672 |
| Portuguese | 89.4 /100 | #131 | Excellent $56,663 |
| Czechs | 88.2 /100 | #132 | Excellent $56,546 |
| Immigrants | Germany | 88.2 /100 | #133 | Excellent $56,542 |
| Moroccans | 87.7 /100 | #134 | Excellent $56,499 |
| Irish | 87.4 /100 | #135 | Excellent $56,464 |