Vietnamese vs Immigrants from Belarus Median Male Earnings
COMPARE
Vietnamese
Immigrants from Belarus
Median Male Earnings
Median Male Earnings Comparison
Vietnamese
Immigrants from Belarus
$52,525
MEDIAN MALE EARNINGS
12.7/ 100
METRIC RATING
207th/ 347
METRIC RANK
$62,658
MEDIAN MALE EARNINGS
100.0/ 100
METRIC RATING
43rd/ 347
METRIC RANK
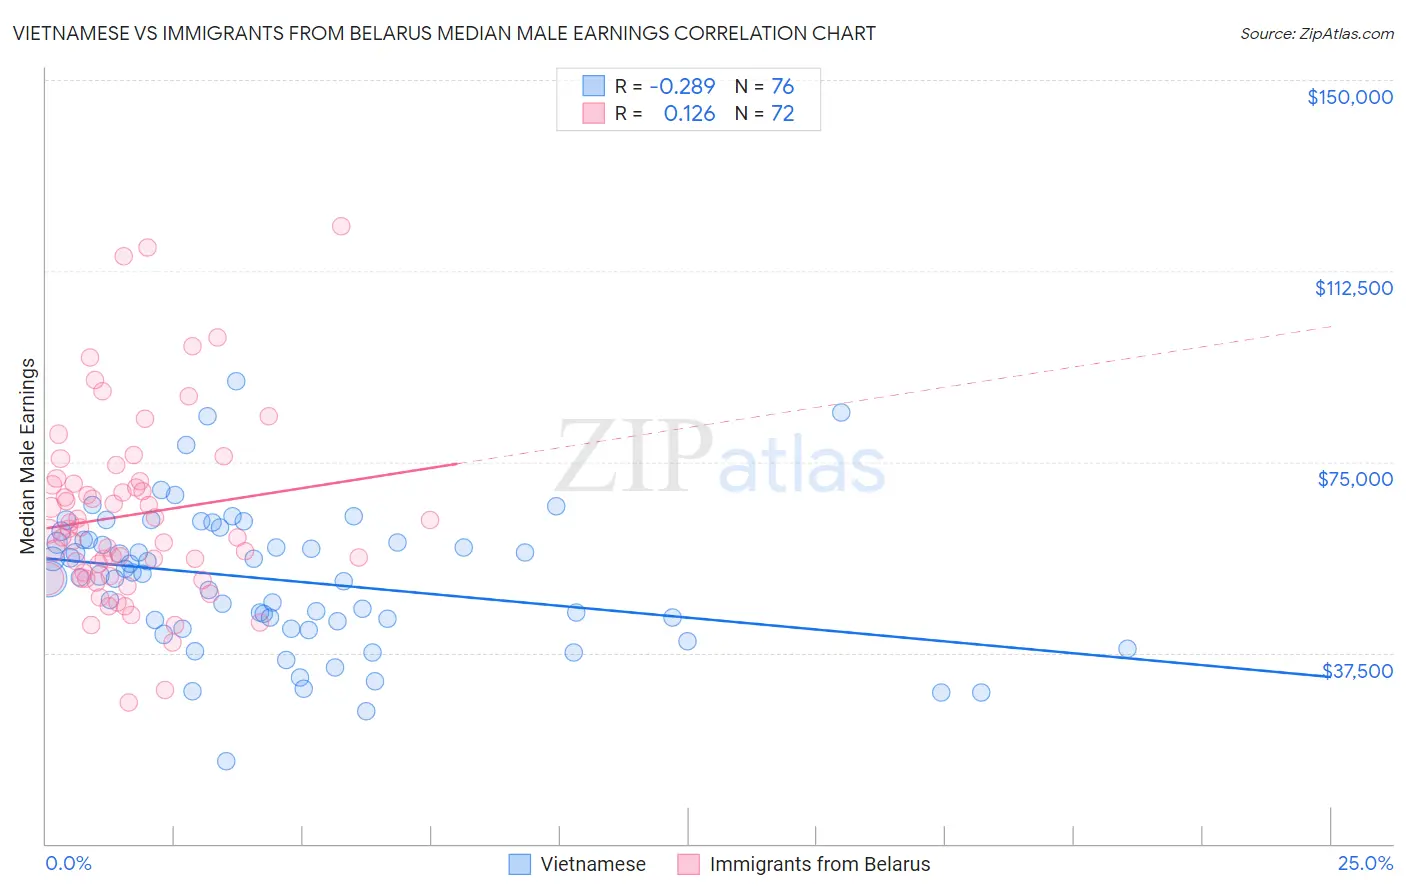
Vietnamese vs Immigrants from Belarus Median Male Earnings Correlation Chart
The statistical analysis conducted on geographies consisting of 170,734,633 people shows a weak negative correlation between the proportion of Vietnamese and median male earnings in the United States with a correlation coefficient (R) of -0.289 and weighted average of $52,525. Similarly, the statistical analysis conducted on geographies consisting of 150,194,615 people shows a poor positive correlation between the proportion of Immigrants from Belarus and median male earnings in the United States with a correlation coefficient (R) of 0.126 and weighted average of $62,658, a difference of 19.3%.
Median Male Earnings Correlation Summary
| Measurement | Vietnamese | Immigrants from Belarus |
| Minimum | $16,146 | $27,820 |
| Maximum | $90,827 | $121,250 |
| Range | $74,681 | $93,430 |
| Mean | $51,791 | $64,628 |
| Median | $52,846 | $61,571 |
| Interquartile 25% (IQ1) | $43,003 | $52,308 |
| Interquartile 75% (IQ3) | $59,635 | $70,925 |
| Interquartile Range (IQR) | $16,633 | $18,618 |
| Standard Deviation (Sample) | $13,801 | $18,362 |
| Standard Deviation (Population) | $13,710 | $18,234 |
Similar Demographics by Median Male Earnings
Demographics Similar to Vietnamese by Median Male Earnings
In terms of median male earnings, the demographic groups most similar to Vietnamese are Venezuelan ($52,510, a difference of 0.030%), Bermudan ($52,465, a difference of 0.11%), Delaware ($52,412, a difference of 0.22%), Tlingit-Haida ($52,409, a difference of 0.22%), and Immigrants from Iraq ($52,681, a difference of 0.30%).
| Demographics | Rating | Rank | Median Male Earnings |
| Immigrants | Thailand | 17.5 /100 | #200 | Poor $52,908 |
| Immigrants | Bosnia and Herzegovina | 16.9 /100 | #201 | Poor $52,869 |
| Immigrants | Uruguay | 16.8 /100 | #202 | Poor $52,860 |
| Panamanians | 16.5 /100 | #203 | Poor $52,835 |
| Ghanaians | 16.1 /100 | #204 | Poor $52,810 |
| Immigrants | Colombia | 15.0 /100 | #205 | Poor $52,725 |
| Immigrants | Iraq | 14.5 /100 | #206 | Poor $52,681 |
| Vietnamese | 12.7 /100 | #207 | Poor $52,525 |
| Venezuelans | 12.5 /100 | #208 | Poor $52,510 |
| Bermudans | 12.1 /100 | #209 | Poor $52,465 |
| Delaware | 11.5 /100 | #210 | Poor $52,412 |
| Tlingit-Haida | 11.5 /100 | #211 | Poor $52,409 |
| Cajuns | 10.7 /100 | #212 | Poor $52,325 |
| Native Hawaiians | 10.5 /100 | #213 | Poor $52,306 |
| Immigrants | Nonimmigrants | 9.3 /100 | #214 | Tragic $52,170 |
Demographics Similar to Immigrants from Belarus by Median Male Earnings
In terms of median male earnings, the demographic groups most similar to Immigrants from Belarus are Immigrants from Greece ($62,689, a difference of 0.050%), Immigrants from Turkey ($62,728, a difference of 0.11%), Cambodian ($62,516, a difference of 0.23%), Australian ($62,857, a difference of 0.32%), and Immigrants from South Africa ($62,899, a difference of 0.38%).
| Demographics | Rating | Rank | Median Male Earnings |
| Israelis | 100.0 /100 | #36 | Exceptional $63,228 |
| Immigrants | Sri Lanka | 100.0 /100 | #37 | Exceptional $63,099 |
| Maltese | 100.0 /100 | #38 | Exceptional $62,953 |
| Immigrants | South Africa | 100.0 /100 | #39 | Exceptional $62,899 |
| Australians | 100.0 /100 | #40 | Exceptional $62,857 |
| Immigrants | Turkey | 100.0 /100 | #41 | Exceptional $62,728 |
| Immigrants | Greece | 100.0 /100 | #42 | Exceptional $62,689 |
| Immigrants | Belarus | 100.0 /100 | #43 | Exceptional $62,658 |
| Cambodians | 100.0 /100 | #44 | Exceptional $62,516 |
| Bulgarians | 100.0 /100 | #45 | Exceptional $62,378 |
| Immigrants | Czechoslovakia | 99.9 /100 | #46 | Exceptional $62,217 |
| Immigrants | Austria | 99.9 /100 | #47 | Exceptional $62,164 |
| Immigrants | Malaysia | 99.9 /100 | #48 | Exceptional $62,121 |
| Immigrants | Europe | 99.9 /100 | #49 | Exceptional $62,057 |
| Bhutanese | 99.9 /100 | #50 | Exceptional $61,759 |