Vietnamese vs Houma Median Male Earnings
COMPARE
Vietnamese
Houma
Median Male Earnings
Median Male Earnings Comparison
Vietnamese
Houma
$52,525
MEDIAN MALE EARNINGS
12.7/ 100
METRIC RATING
207th/ 347
METRIC RANK
$50,547
MEDIAN MALE EARNINGS
2.0/ 100
METRIC RATING
244th/ 347
METRIC RANK
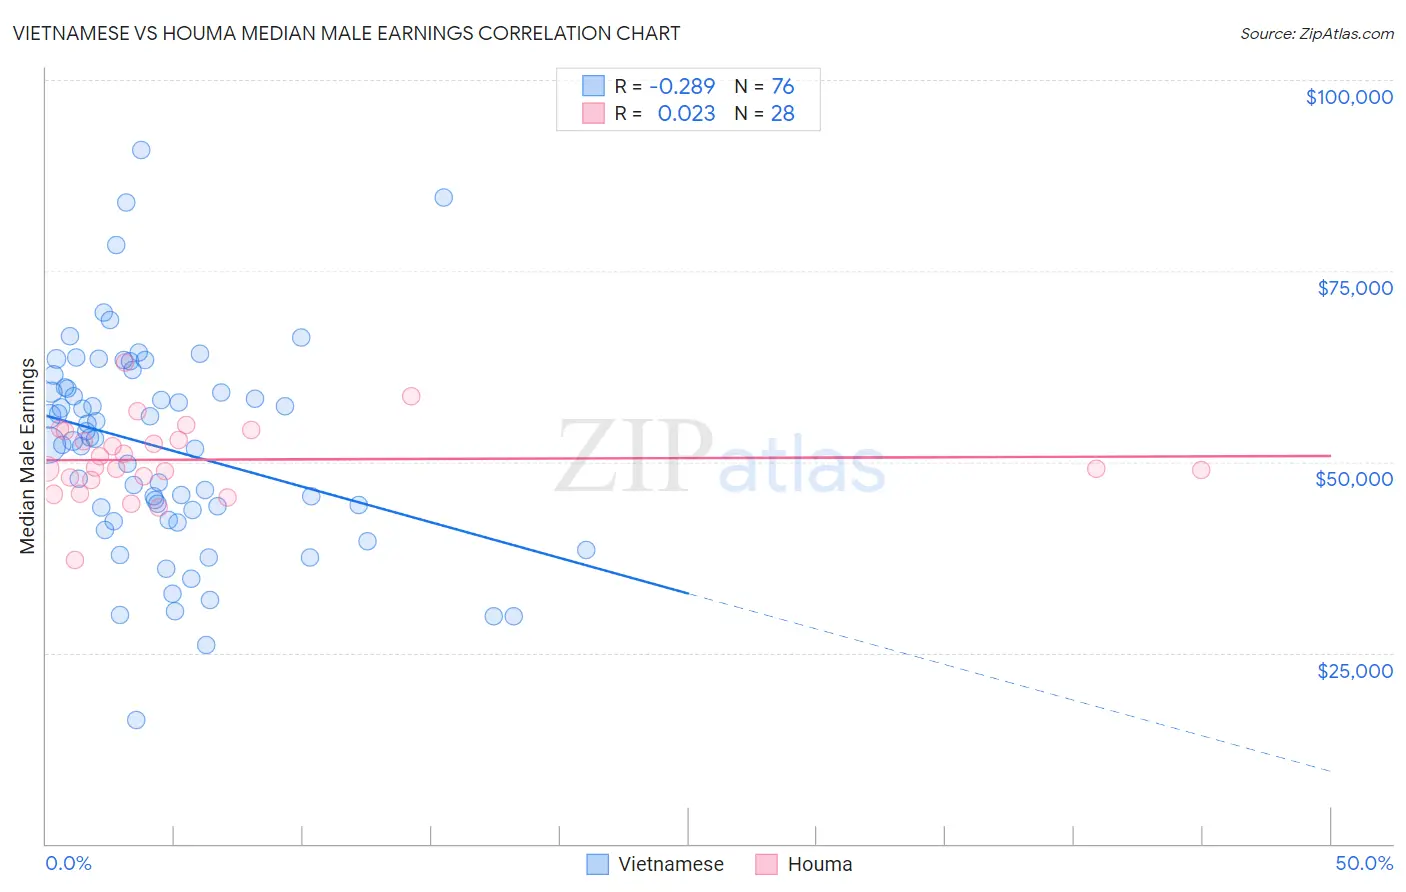
Vietnamese vs Houma Median Male Earnings Correlation Chart
The statistical analysis conducted on geographies consisting of 170,734,633 people shows a weak negative correlation between the proportion of Vietnamese and median male earnings in the United States with a correlation coefficient (R) of -0.289 and weighted average of $52,525. Similarly, the statistical analysis conducted on geographies consisting of 36,794,653 people shows no correlation between the proportion of Houma and median male earnings in the United States with a correlation coefficient (R) of 0.023 and weighted average of $50,547, a difference of 3.9%.
Median Male Earnings Correlation Summary
| Measurement | Vietnamese | Houma |
| Minimum | $16,146 | $37,208 |
| Maximum | $90,827 | $62,981 |
| Range | $74,681 | $25,773 |
| Mean | $51,791 | $50,295 |
| Median | $52,846 | $49,219 |
| Interquartile 25% (IQ1) | $43,003 | $47,813 |
| Interquartile 75% (IQ3) | $59,635 | $53,443 |
| Interquartile Range (IQR) | $16,633 | $5,630 |
| Standard Deviation (Sample) | $13,801 | $5,065 |
| Standard Deviation (Population) | $13,710 | $4,974 |
Similar Demographics by Median Male Earnings
Demographics Similar to Vietnamese by Median Male Earnings
In terms of median male earnings, the demographic groups most similar to Vietnamese are Venezuelan ($52,510, a difference of 0.030%), Bermudan ($52,465, a difference of 0.11%), Delaware ($52,412, a difference of 0.22%), Tlingit-Haida ($52,409, a difference of 0.22%), and Immigrants from Iraq ($52,681, a difference of 0.30%).
| Demographics | Rating | Rank | Median Male Earnings |
| Immigrants | Thailand | 17.5 /100 | #200 | Poor $52,908 |
| Immigrants | Bosnia and Herzegovina | 16.9 /100 | #201 | Poor $52,869 |
| Immigrants | Uruguay | 16.8 /100 | #202 | Poor $52,860 |
| Panamanians | 16.5 /100 | #203 | Poor $52,835 |
| Ghanaians | 16.1 /100 | #204 | Poor $52,810 |
| Immigrants | Colombia | 15.0 /100 | #205 | Poor $52,725 |
| Immigrants | Iraq | 14.5 /100 | #206 | Poor $52,681 |
| Vietnamese | 12.7 /100 | #207 | Poor $52,525 |
| Venezuelans | 12.5 /100 | #208 | Poor $52,510 |
| Bermudans | 12.1 /100 | #209 | Poor $52,465 |
| Delaware | 11.5 /100 | #210 | Poor $52,412 |
| Tlingit-Haida | 11.5 /100 | #211 | Poor $52,409 |
| Cajuns | 10.7 /100 | #212 | Poor $52,325 |
| Native Hawaiians | 10.5 /100 | #213 | Poor $52,306 |
| Immigrants | Nonimmigrants | 9.3 /100 | #214 | Tragic $52,170 |
Demographics Similar to Houma by Median Male Earnings
In terms of median male earnings, the demographic groups most similar to Houma are Hawaiian ($50,488, a difference of 0.12%), Guyanese ($50,613, a difference of 0.13%), French American Indian ($50,611, a difference of 0.13%), Immigrants from Ecuador ($50,474, a difference of 0.14%), and Immigrants from St. Vincent and the Grenadines ($50,665, a difference of 0.23%).
| Demographics | Rating | Rank | Median Male Earnings |
| Immigrants | Barbados | 2.6 /100 | #237 | Tragic $50,795 |
| Malaysians | 2.5 /100 | #238 | Tragic $50,772 |
| Americans | 2.5 /100 | #239 | Tragic $50,761 |
| West Indians | 2.3 /100 | #240 | Tragic $50,682 |
| Immigrants | St. Vincent and the Grenadines | 2.3 /100 | #241 | Tragic $50,665 |
| Guyanese | 2.2 /100 | #242 | Tragic $50,613 |
| French American Indians | 2.2 /100 | #243 | Tragic $50,611 |
| Houma | 2.0 /100 | #244 | Tragic $50,547 |
| Hawaiians | 1.9 /100 | #245 | Tragic $50,488 |
| Immigrants | Ecuador | 1.9 /100 | #246 | Tragic $50,474 |
| Sub-Saharan Africans | 1.8 /100 | #247 | Tragic $50,408 |
| Immigrants | Guyana | 1.6 /100 | #248 | Tragic $50,321 |
| Immigrants | Burma/Myanmar | 1.6 /100 | #249 | Tragic $50,298 |
| Osage | 1.6 /100 | #250 | Tragic $50,292 |
| Immigrants | Grenada | 1.6 /100 | #251 | Tragic $50,279 |