Palestinian vs Houma Median Male Earnings
COMPARE
Palestinian
Houma
Median Male Earnings
Median Male Earnings Comparison
Palestinians
Houma
$57,778
MEDIAN MALE EARNINGS
96.2/ 100
METRIC RATING
110th/ 347
METRIC RANK
$50,547
MEDIAN MALE EARNINGS
2.0/ 100
METRIC RATING
244th/ 347
METRIC RANK
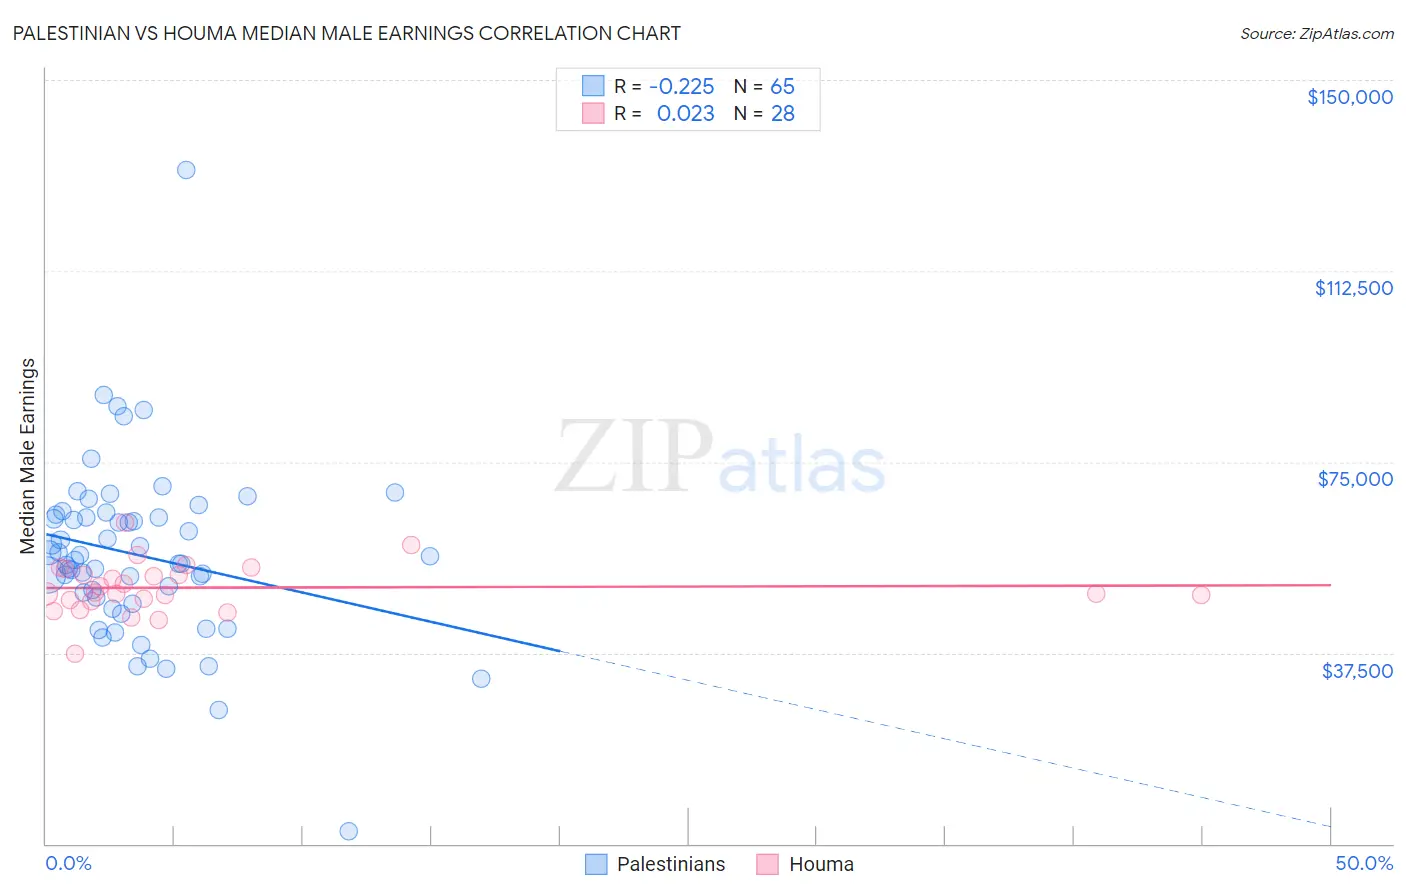
Palestinian vs Houma Median Male Earnings Correlation Chart
The statistical analysis conducted on geographies consisting of 216,446,429 people shows a weak negative correlation between the proportion of Palestinians and median male earnings in the United States with a correlation coefficient (R) of -0.225 and weighted average of $57,778. Similarly, the statistical analysis conducted on geographies consisting of 36,794,653 people shows no correlation between the proportion of Houma and median male earnings in the United States with a correlation coefficient (R) of 0.023 and weighted average of $50,547, a difference of 14.3%.
Median Male Earnings Correlation Summary
| Measurement | Palestinian | Houma |
| Minimum | $2,499 | $37,208 |
| Maximum | $132,344 | $62,981 |
| Range | $129,845 | $25,773 |
| Mean | $56,632 | $50,295 |
| Median | $55,657 | $49,219 |
| Interquartile 25% (IQ1) | $47,716 | $47,813 |
| Interquartile 75% (IQ3) | $64,385 | $53,443 |
| Interquartile Range (IQR) | $16,670 | $5,630 |
| Standard Deviation (Sample) | $17,442 | $5,065 |
| Standard Deviation (Population) | $17,308 | $4,974 |
Similar Demographics by Median Male Earnings
Demographics Similar to Palestinians by Median Male Earnings
In terms of median male earnings, the demographic groups most similar to Palestinians are British ($57,890, a difference of 0.19%), European ($57,637, a difference of 0.25%), Immigrants from Uzbekistan ($57,941, a difference of 0.28%), Serbian ($57,975, a difference of 0.34%), and Immigrants from Afghanistan ($57,582, a difference of 0.34%).
| Demographics | Rating | Rank | Median Male Earnings |
| Poles | 97.3 /100 | #103 | Exceptional $58,139 |
| Armenians | 97.3 /100 | #104 | Exceptional $58,134 |
| Immigrants | Western Asia | 97.3 /100 | #105 | Exceptional $58,131 |
| Immigrants | Northern Africa | 96.9 /100 | #106 | Exceptional $58,008 |
| Serbians | 96.8 /100 | #107 | Exceptional $57,975 |
| Immigrants | Uzbekistan | 96.7 /100 | #108 | Exceptional $57,941 |
| British | 96.5 /100 | #109 | Exceptional $57,890 |
| Palestinians | 96.2 /100 | #110 | Exceptional $57,778 |
| Europeans | 95.6 /100 | #111 | Exceptional $57,637 |
| Immigrants | Afghanistan | 95.4 /100 | #112 | Exceptional $57,582 |
| Carpatho Rusyns | 95.3 /100 | #113 | Exceptional $57,572 |
| Immigrants | Kuwait | 95.3 /100 | #114 | Exceptional $57,562 |
| Swedes | 94.8 /100 | #115 | Exceptional $57,445 |
| Lebanese | 94.6 /100 | #116 | Exceptional $57,409 |
| Immigrants | Zimbabwe | 94.3 /100 | #117 | Exceptional $57,352 |
Demographics Similar to Houma by Median Male Earnings
In terms of median male earnings, the demographic groups most similar to Houma are Hawaiian ($50,488, a difference of 0.12%), Guyanese ($50,613, a difference of 0.13%), French American Indian ($50,611, a difference of 0.13%), Immigrants from Ecuador ($50,474, a difference of 0.14%), and Immigrants from St. Vincent and the Grenadines ($50,665, a difference of 0.23%).
| Demographics | Rating | Rank | Median Male Earnings |
| Immigrants | Barbados | 2.6 /100 | #237 | Tragic $50,795 |
| Malaysians | 2.5 /100 | #238 | Tragic $50,772 |
| Americans | 2.5 /100 | #239 | Tragic $50,761 |
| West Indians | 2.3 /100 | #240 | Tragic $50,682 |
| Immigrants | St. Vincent and the Grenadines | 2.3 /100 | #241 | Tragic $50,665 |
| Guyanese | 2.2 /100 | #242 | Tragic $50,613 |
| French American Indians | 2.2 /100 | #243 | Tragic $50,611 |
| Houma | 2.0 /100 | #244 | Tragic $50,547 |
| Hawaiians | 1.9 /100 | #245 | Tragic $50,488 |
| Immigrants | Ecuador | 1.9 /100 | #246 | Tragic $50,474 |
| Sub-Saharan Africans | 1.8 /100 | #247 | Tragic $50,408 |
| Immigrants | Guyana | 1.6 /100 | #248 | Tragic $50,321 |
| Immigrants | Burma/Myanmar | 1.6 /100 | #249 | Tragic $50,298 |
| Osage | 1.6 /100 | #250 | Tragic $50,292 |
| Immigrants | Grenada | 1.6 /100 | #251 | Tragic $50,279 |