Ukrainian vs Guamanian/Chamorro Householder Income Under 25 years
COMPARE
Ukrainian
Guamanian/Chamorro
Householder Income Under 25 years
Householder Income Under 25 years Comparison
Ukrainians
Guamanians/Chamorros
$53,843
HOUSEHOLDER INCOME UNDER 25 YEARS
98.3/ 100
METRIC RATING
103rd/ 347
METRIC RANK
$53,423
HOUSEHOLDER INCOME UNDER 25 YEARS
95.3/ 100
METRIC RATING
120th/ 347
METRIC RANK
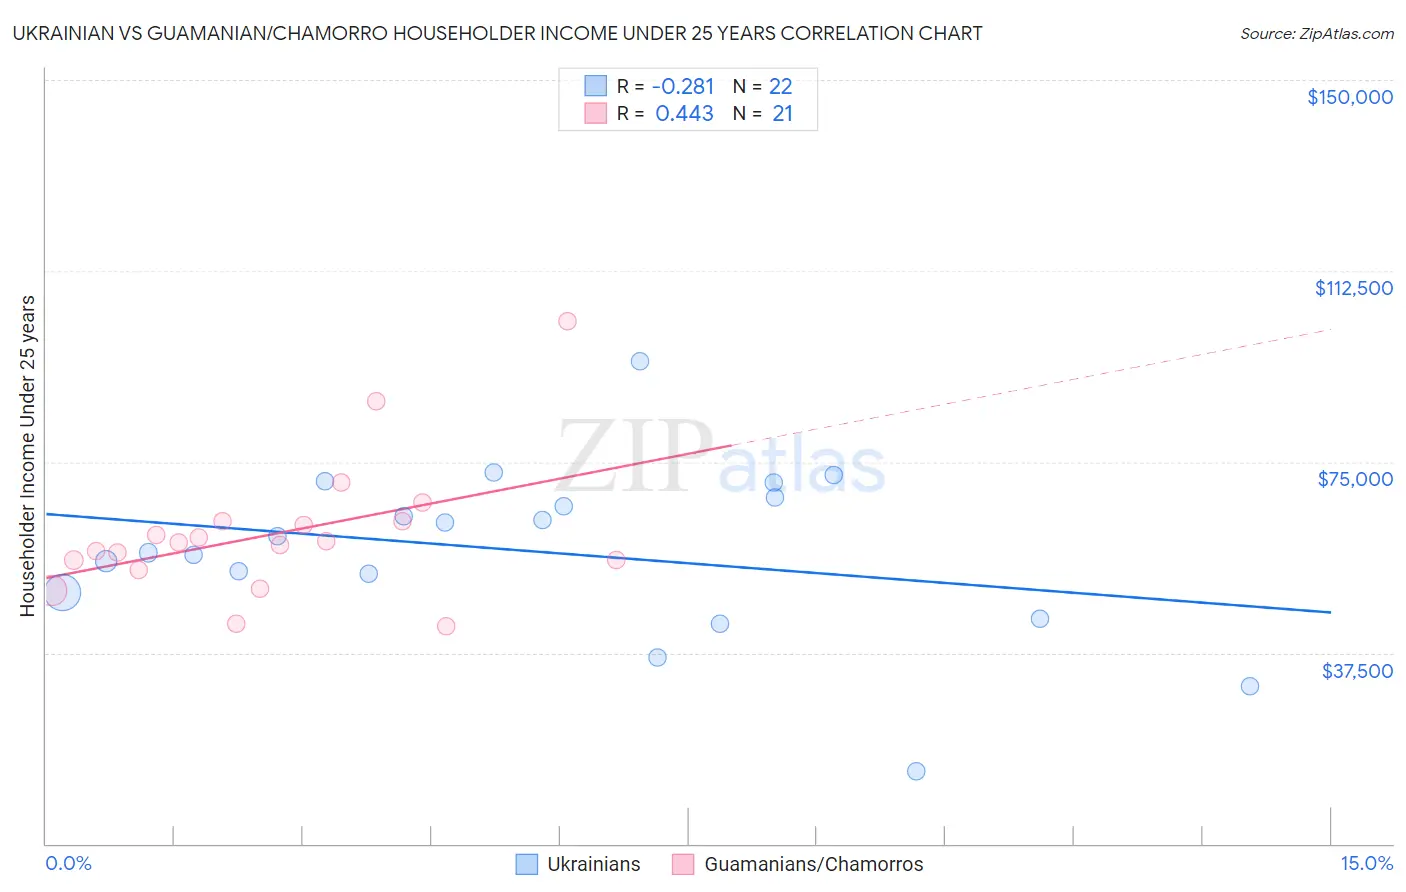
Ukrainian vs Guamanian/Chamorro Householder Income Under 25 years Correlation Chart
The statistical analysis conducted on geographies consisting of 365,367,408 people shows a weak negative correlation between the proportion of Ukrainians and household income with householder under the age of 25 in the United States with a correlation coefficient (R) of -0.281 and weighted average of $53,843. Similarly, the statistical analysis conducted on geographies consisting of 200,760,858 people shows a moderate positive correlation between the proportion of Guamanians/Chamorros and household income with householder under the age of 25 in the United States with a correlation coefficient (R) of 0.443 and weighted average of $53,423, a difference of 0.79%.
Householder Income Under 25 years Correlation Summary
| Measurement | Ukrainian | Guamanian/Chamorro |
| Minimum | $14,236 | $42,829 |
| Maximum | $94,821 | $102,571 |
| Range | $80,585 | $59,742 |
| Mean | $57,387 | $60,959 |
| Median | $58,725 | $59,082 |
| Interquartile 25% (IQ1) | $49,424 | $54,739 |
| Interquartile 75% (IQ3) | $67,932 | $63,324 |
| Interquartile Range (IQR) | $18,508 | $8,585 |
| Standard Deviation (Sample) | $16,958 | $13,387 |
| Standard Deviation (Population) | $16,568 | $13,064 |
Demographics Similar to Ukrainians and Guamanians/Chamorros by Householder Income Under 25 years
In terms of householder income under 25 years, the demographic groups most similar to Ukrainians are Ethiopian ($53,818, a difference of 0.050%), Immigrants from France ($53,805, a difference of 0.070%), Albanian ($53,794, a difference of 0.090%), Ecuadorian ($53,911, a difference of 0.13%), and South American ($53,939, a difference of 0.18%). Similarly, the demographic groups most similar to Guamanians/Chamorros are Italian ($53,426, a difference of 0.010%), Immigrants from Canada ($53,411, a difference of 0.020%), Immigrants from Switzerland ($53,528, a difference of 0.20%), Lithuanian ($53,552, a difference of 0.24%), and Immigrants from Spain ($53,560, a difference of 0.26%).
| Demographics | Rating | Rank | Householder Income Under 25 years |
| South Americans | 98.6 /100 | #101 | Exceptional $53,939 |
| Ecuadorians | 98.5 /100 | #102 | Exceptional $53,911 |
| Ukrainians | 98.3 /100 | #103 | Exceptional $53,843 |
| Ethiopians | 98.2 /100 | #104 | Exceptional $53,818 |
| Immigrants | France | 98.1 /100 | #105 | Exceptional $53,805 |
| Albanians | 98.1 /100 | #106 | Exceptional $53,794 |
| Australians | 97.8 /100 | #107 | Exceptional $53,739 |
| Maltese | 97.8 /100 | #108 | Exceptional $53,735 |
| Immigrants | Ecuador | 97.7 /100 | #109 | Exceptional $53,722 |
| Greeks | 97.7 /100 | #110 | Exceptional $53,715 |
| Immigrants | Colombia | 97.7 /100 | #111 | Exceptional $53,714 |
| Immigrants | Oceania | 97.5 /100 | #112 | Exceptional $53,680 |
| Romanians | 97.2 /100 | #113 | Exceptional $53,632 |
| Immigrants | Sweden | 97.1 /100 | #114 | Exceptional $53,621 |
| Immigrants | Albania | 96.9 /100 | #115 | Exceptional $53,597 |
| Immigrants | Spain | 96.6 /100 | #116 | Exceptional $53,560 |
| Lithuanians | 96.6 /100 | #117 | Exceptional $53,552 |
| Immigrants | Switzerland | 96.3 /100 | #118 | Exceptional $53,528 |
| Italians | 95.4 /100 | #119 | Exceptional $53,426 |
| Guamanians/Chamorros | 95.3 /100 | #120 | Exceptional $53,423 |
| Immigrants | Canada | 95.2 /100 | #121 | Exceptional $53,411 |