Ukrainian vs Brazilian Householder Income Under 25 years
COMPARE
Ukrainian
Brazilian
Householder Income Under 25 years
Householder Income Under 25 years Comparison
Ukrainians
Brazilians
$53,843
HOUSEHOLDER INCOME UNDER 25 YEARS
98.3/ 100
METRIC RATING
103rd/ 347
METRIC RANK
$54,335
HOUSEHOLDER INCOME UNDER 25 YEARS
99.5/ 100
METRIC RATING
87th/ 347
METRIC RANK
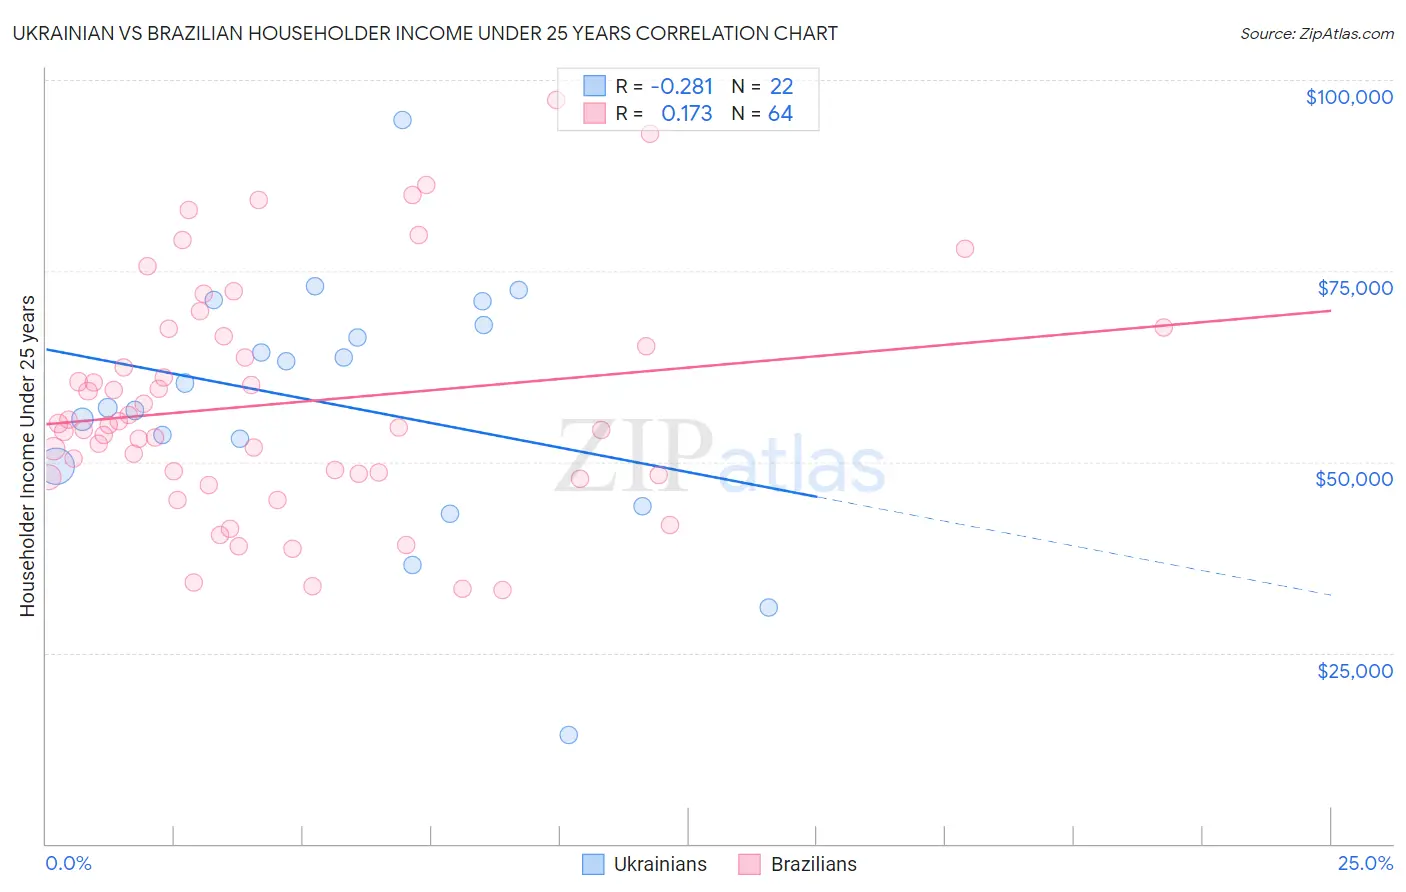
Ukrainian vs Brazilian Householder Income Under 25 years Correlation Chart
The statistical analysis conducted on geographies consisting of 365,367,408 people shows a weak negative correlation between the proportion of Ukrainians and household income with householder under the age of 25 in the United States with a correlation coefficient (R) of -0.281 and weighted average of $53,843. Similarly, the statistical analysis conducted on geographies consisting of 277,651,798 people shows a poor positive correlation between the proportion of Brazilians and household income with householder under the age of 25 in the United States with a correlation coefficient (R) of 0.173 and weighted average of $54,335, a difference of 0.91%.
Householder Income Under 25 years Correlation Summary
| Measurement | Ukrainian | Brazilian |
| Minimum | $14,236 | $33,271 |
| Maximum | $94,821 | $97,399 |
| Range | $80,585 | $64,128 |
| Mean | $57,387 | $57,617 |
| Median | $58,725 | $54,675 |
| Interquartile 25% (IQ1) | $49,424 | $48,409 |
| Interquartile 75% (IQ3) | $67,932 | $65,785 |
| Interquartile Range (IQR) | $18,508 | $17,376 |
| Standard Deviation (Sample) | $16,958 | $14,874 |
| Standard Deviation (Population) | $16,568 | $14,757 |
Demographics Similar to Ukrainians and Brazilians by Householder Income Under 25 years
In terms of householder income under 25 years, the demographic groups most similar to Ukrainians are Ethiopian ($53,818, a difference of 0.050%), Immigrants from France ($53,805, a difference of 0.070%), Ecuadorian ($53,911, a difference of 0.13%), South American ($53,939, a difference of 0.18%), and Immigrants from Kazakhstan ($53,990, a difference of 0.27%). Similarly, the demographic groups most similar to Brazilians are Immigrants from Croatia ($54,343, a difference of 0.020%), Immigrants from Czechoslovakia ($54,352, a difference of 0.030%), Yakama ($54,321, a difference of 0.030%), Immigrants from South America ($54,268, a difference of 0.12%), and Turkish ($54,266, a difference of 0.13%).
| Demographics | Rating | Rank | Householder Income Under 25 years |
| Immigrants | Czechoslovakia | 99.5 /100 | #85 | Exceptional $54,352 |
| Immigrants | Croatia | 99.5 /100 | #86 | Exceptional $54,343 |
| Brazilians | 99.5 /100 | #87 | Exceptional $54,335 |
| Yakama | 99.5 /100 | #88 | Exceptional $54,321 |
| Immigrants | South America | 99.4 /100 | #89 | Exceptional $54,268 |
| Turks | 99.4 /100 | #90 | Exceptional $54,266 |
| Immigrants | Egypt | 99.3 /100 | #91 | Exceptional $54,239 |
| Immigrants | St. Vincent and the Grenadines | 99.3 /100 | #92 | Exceptional $54,230 |
| Immigrants | Argentina | 99.3 /100 | #93 | Exceptional $54,209 |
| Immigrants | Sierra Leone | 99.3 /100 | #94 | Exceptional $54,190 |
| Immigrants | Malaysia | 99.2 /100 | #95 | Exceptional $54,179 |
| Argentineans | 99.2 /100 | #96 | Exceptional $54,154 |
| Immigrants | Portugal | 99.1 /100 | #97 | Exceptional $54,105 |
| Eastern Europeans | 99.0 /100 | #98 | Exceptional $54,066 |
| Alaska Natives | 98.8 /100 | #99 | Exceptional $54,000 |
| Immigrants | Kazakhstan | 98.8 /100 | #100 | Exceptional $53,990 |
| South Americans | 98.6 /100 | #101 | Exceptional $53,939 |
| Ecuadorians | 98.5 /100 | #102 | Exceptional $53,911 |
| Ukrainians | 98.3 /100 | #103 | Exceptional $53,843 |
| Ethiopians | 98.2 /100 | #104 | Exceptional $53,818 |
| Immigrants | France | 98.1 /100 | #105 | Exceptional $53,805 |