Honduran vs Guamanian/Chamorro Householder Income Under 25 years
COMPARE
Honduran
Guamanian/Chamorro
Householder Income Under 25 years
Householder Income Under 25 years Comparison
Hondurans
Guamanians/Chamorros
$48,885
HOUSEHOLDER INCOME UNDER 25 YEARS
0.0/ 100
METRIC RATING
289th/ 347
METRIC RANK
$53,423
HOUSEHOLDER INCOME UNDER 25 YEARS
95.3/ 100
METRIC RATING
120th/ 347
METRIC RANK
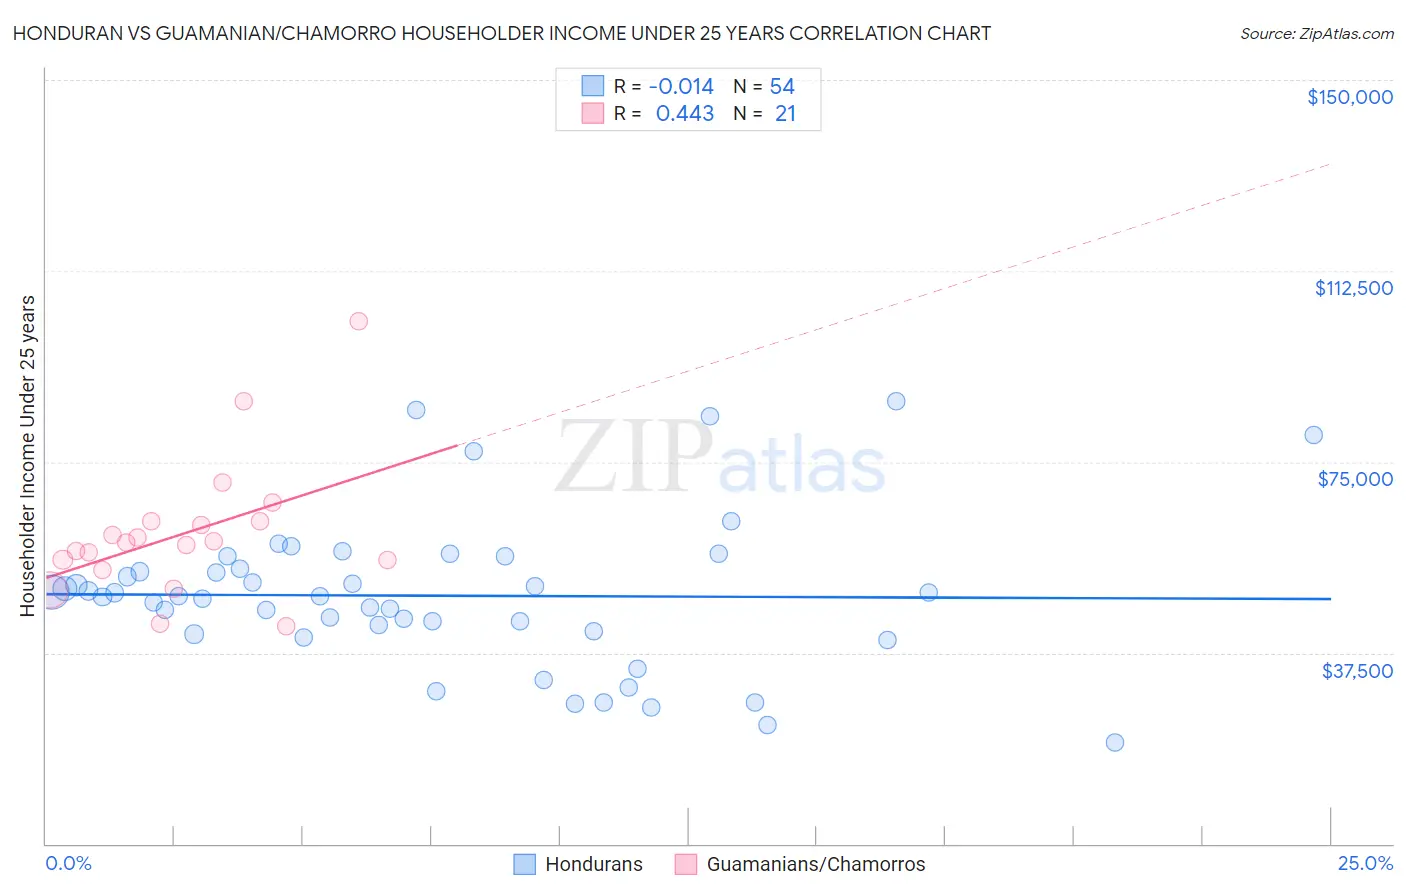
Honduran vs Guamanian/Chamorro Householder Income Under 25 years Correlation Chart
The statistical analysis conducted on geographies consisting of 310,566,711 people shows no correlation between the proportion of Hondurans and household income with householder under the age of 25 in the United States with a correlation coefficient (R) of -0.014 and weighted average of $48,885. Similarly, the statistical analysis conducted on geographies consisting of 200,760,858 people shows a moderate positive correlation between the proportion of Guamanians/Chamorros and household income with householder under the age of 25 in the United States with a correlation coefficient (R) of 0.443 and weighted average of $53,423, a difference of 9.3%.
Householder Income Under 25 years Correlation Summary
| Measurement | Honduran | Guamanian/Chamorro |
| Minimum | $19,963 | $42,829 |
| Maximum | $86,950 | $102,571 |
| Range | $66,987 | $59,742 |
| Mean | $48,732 | $60,959 |
| Median | $48,619 | $59,082 |
| Interquartile 25% (IQ1) | $41,617 | $54,739 |
| Interquartile 75% (IQ3) | $53,996 | $63,324 |
| Interquartile Range (IQR) | $12,378 | $8,585 |
| Standard Deviation (Sample) | $14,744 | $13,387 |
| Standard Deviation (Population) | $14,607 | $13,064 |
Similar Demographics by Householder Income Under 25 years
Demographics Similar to Hondurans by Householder Income Under 25 years
In terms of householder income under 25 years, the demographic groups most similar to Hondurans are American ($48,860, a difference of 0.050%), Liberian ($48,917, a difference of 0.060%), Senegalese ($48,953, a difference of 0.14%), French American Indian ($48,977, a difference of 0.19%), and Immigrants from Burma/Myanmar ($48,749, a difference of 0.28%).
| Demographics | Rating | Rank | Householder Income Under 25 years |
| Alsatians | 0.1 /100 | #282 | Tragic $49,267 |
| Immigrants | Nigeria | 0.1 /100 | #283 | Tragic $49,174 |
| Carpatho Rusyns | 0.1 /100 | #284 | Tragic $49,113 |
| Scotch-Irish | 0.0 /100 | #285 | Tragic $49,039 |
| French American Indians | 0.0 /100 | #286 | Tragic $48,977 |
| Senegalese | 0.0 /100 | #287 | Tragic $48,953 |
| Liberians | 0.0 /100 | #288 | Tragic $48,917 |
| Hondurans | 0.0 /100 | #289 | Tragic $48,885 |
| Americans | 0.0 /100 | #290 | Tragic $48,860 |
| Immigrants | Burma/Myanmar | 0.0 /100 | #291 | Tragic $48,749 |
| Shoshone | 0.0 /100 | #292 | Tragic $48,720 |
| Sub-Saharan Africans | 0.0 /100 | #293 | Tragic $48,691 |
| Somalis | 0.0 /100 | #294 | Tragic $48,657 |
| Central American Indians | 0.0 /100 | #295 | Tragic $48,643 |
| Blackfeet | 0.0 /100 | #296 | Tragic $48,603 |
Demographics Similar to Guamanians/Chamorros by Householder Income Under 25 years
In terms of householder income under 25 years, the demographic groups most similar to Guamanians/Chamorros are Italian ($53,426, a difference of 0.010%), Immigrants from Canada ($53,411, a difference of 0.020%), Immigrants from Ethiopia ($53,408, a difference of 0.030%), Immigrants from Iraq ($53,384, a difference of 0.070%), and Colombian ($53,357, a difference of 0.12%).
| Demographics | Rating | Rank | Householder Income Under 25 years |
| Romanians | 97.2 /100 | #113 | Exceptional $53,632 |
| Immigrants | Sweden | 97.1 /100 | #114 | Exceptional $53,621 |
| Immigrants | Albania | 96.9 /100 | #115 | Exceptional $53,597 |
| Immigrants | Spain | 96.6 /100 | #116 | Exceptional $53,560 |
| Lithuanians | 96.6 /100 | #117 | Exceptional $53,552 |
| Immigrants | Switzerland | 96.3 /100 | #118 | Exceptional $53,528 |
| Italians | 95.4 /100 | #119 | Exceptional $53,426 |
| Guamanians/Chamorros | 95.3 /100 | #120 | Exceptional $53,423 |
| Immigrants | Canada | 95.2 /100 | #121 | Exceptional $53,411 |
| Immigrants | Ethiopia | 95.2 /100 | #122 | Exceptional $53,408 |
| Immigrants | Iraq | 94.9 /100 | #123 | Exceptional $53,384 |
| Colombians | 94.6 /100 | #124 | Exceptional $53,357 |
| Pakistanis | 94.1 /100 | #125 | Exceptional $53,325 |
| Immigrants | Serbia | 94.1 /100 | #126 | Exceptional $53,321 |
| Immigrants | North America | 93.9 /100 | #127 | Exceptional $53,307 |