Ukrainian vs South African Householder Income Under 25 years
COMPARE
Ukrainian
South African
Householder Income Under 25 years
Householder Income Under 25 years Comparison
Ukrainians
South Africans
$53,843
HOUSEHOLDER INCOME UNDER 25 YEARS
98.3/ 100
METRIC RATING
103rd/ 347
METRIC RANK
$51,383
HOUSEHOLDER INCOME UNDER 25 YEARS
12.2/ 100
METRIC RATING
207th/ 347
METRIC RANK
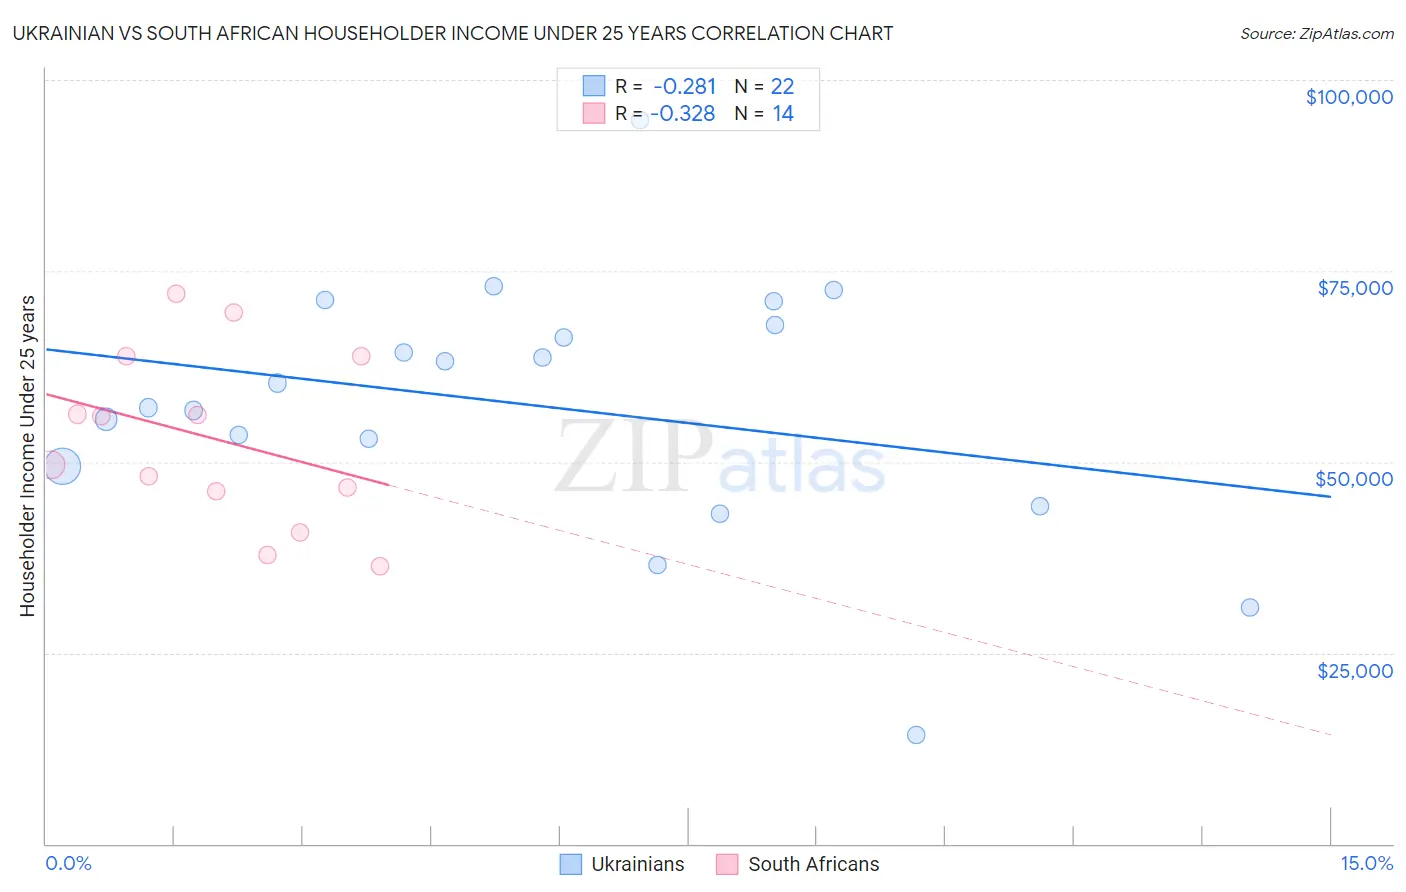
Ukrainian vs South African Householder Income Under 25 years Correlation Chart
The statistical analysis conducted on geographies consisting of 365,367,408 people shows a weak negative correlation between the proportion of Ukrainians and household income with householder under the age of 25 in the United States with a correlation coefficient (R) of -0.281 and weighted average of $53,843. Similarly, the statistical analysis conducted on geographies consisting of 162,551,687 people shows a mild negative correlation between the proportion of South Africans and household income with householder under the age of 25 in the United States with a correlation coefficient (R) of -0.328 and weighted average of $51,383, a difference of 4.8%.
Householder Income Under 25 years Correlation Summary
| Measurement | Ukrainian | South African |
| Minimum | $14,236 | $36,406 |
| Maximum | $94,821 | $72,020 |
| Range | $80,585 | $35,614 |
| Mean | $57,387 | $53,067 |
| Median | $58,725 | $52,781 |
| Interquartile 25% (IQ1) | $49,424 | $46,113 |
| Interquartile 75% (IQ3) | $67,932 | $63,791 |
| Interquartile Range (IQR) | $18,508 | $17,678 |
| Standard Deviation (Sample) | $16,958 | $11,360 |
| Standard Deviation (Population) | $16,568 | $10,947 |
Similar Demographics by Householder Income Under 25 years
Demographics Similar to Ukrainians by Householder Income Under 25 years
In terms of householder income under 25 years, the demographic groups most similar to Ukrainians are Ethiopian ($53,818, a difference of 0.050%), Immigrants from France ($53,805, a difference of 0.070%), Albanian ($53,794, a difference of 0.090%), Ecuadorian ($53,911, a difference of 0.13%), and South American ($53,939, a difference of 0.18%).
| Demographics | Rating | Rank | Householder Income Under 25 years |
| Argentineans | 99.2 /100 | #96 | Exceptional $54,154 |
| Immigrants | Portugal | 99.1 /100 | #97 | Exceptional $54,105 |
| Eastern Europeans | 99.0 /100 | #98 | Exceptional $54,066 |
| Alaska Natives | 98.8 /100 | #99 | Exceptional $54,000 |
| Immigrants | Kazakhstan | 98.8 /100 | #100 | Exceptional $53,990 |
| South Americans | 98.6 /100 | #101 | Exceptional $53,939 |
| Ecuadorians | 98.5 /100 | #102 | Exceptional $53,911 |
| Ukrainians | 98.3 /100 | #103 | Exceptional $53,843 |
| Ethiopians | 98.2 /100 | #104 | Exceptional $53,818 |
| Immigrants | France | 98.1 /100 | #105 | Exceptional $53,805 |
| Albanians | 98.1 /100 | #106 | Exceptional $53,794 |
| Australians | 97.8 /100 | #107 | Exceptional $53,739 |
| Maltese | 97.8 /100 | #108 | Exceptional $53,735 |
| Immigrants | Ecuador | 97.7 /100 | #109 | Exceptional $53,722 |
| Greeks | 97.7 /100 | #110 | Exceptional $53,715 |
Demographics Similar to South Africans by Householder Income Under 25 years
In terms of householder income under 25 years, the demographic groups most similar to South Africans are Cape Verdean ($51,387, a difference of 0.010%), Immigrants from Latin America ($51,387, a difference of 0.010%), Immigrants from Jordan ($51,370, a difference of 0.020%), Syrian ($51,353, a difference of 0.060%), and Czech ($51,421, a difference of 0.070%).
| Demographics | Rating | Rank | Householder Income Under 25 years |
| Immigrants | West Indies | 14.9 /100 | #200 | Poor $51,479 |
| British | 14.9 /100 | #201 | Poor $51,477 |
| Immigrants | Guatemala | 14.0 /100 | #202 | Poor $51,447 |
| Immigrants | Cameroon | 13.6 /100 | #203 | Poor $51,433 |
| Czechs | 13.2 /100 | #204 | Poor $51,421 |
| Cape Verdeans | 12.3 /100 | #205 | Poor $51,387 |
| Immigrants | Latin America | 12.3 /100 | #206 | Poor $51,387 |
| South Africans | 12.2 /100 | #207 | Poor $51,383 |
| Immigrants | Jordan | 11.9 /100 | #208 | Poor $51,370 |
| Syrians | 11.4 /100 | #209 | Poor $51,353 |
| Immigrants | Ghana | 10.9 /100 | #210 | Poor $51,333 |
| Irish | 10.6 /100 | #211 | Poor $51,317 |
| Immigrants | Panama | 9.7 /100 | #212 | Tragic $51,278 |
| Dutch | 9.4 /100 | #213 | Tragic $51,265 |
| Zimbabweans | 9.3 /100 | #214 | Tragic $51,259 |