Tsimshian vs Guamanian/Chamorro Householder Income Under 25 years
COMPARE
Tsimshian
Guamanian/Chamorro
Householder Income Under 25 years
Householder Income Under 25 years Comparison
Tsimshian
Guamanians/Chamorros
$54,649
HOUSEHOLDER INCOME UNDER 25 YEARS
99.8/ 100
METRIC RATING
68th/ 347
METRIC RANK
$53,423
HOUSEHOLDER INCOME UNDER 25 YEARS
95.3/ 100
METRIC RATING
120th/ 347
METRIC RANK
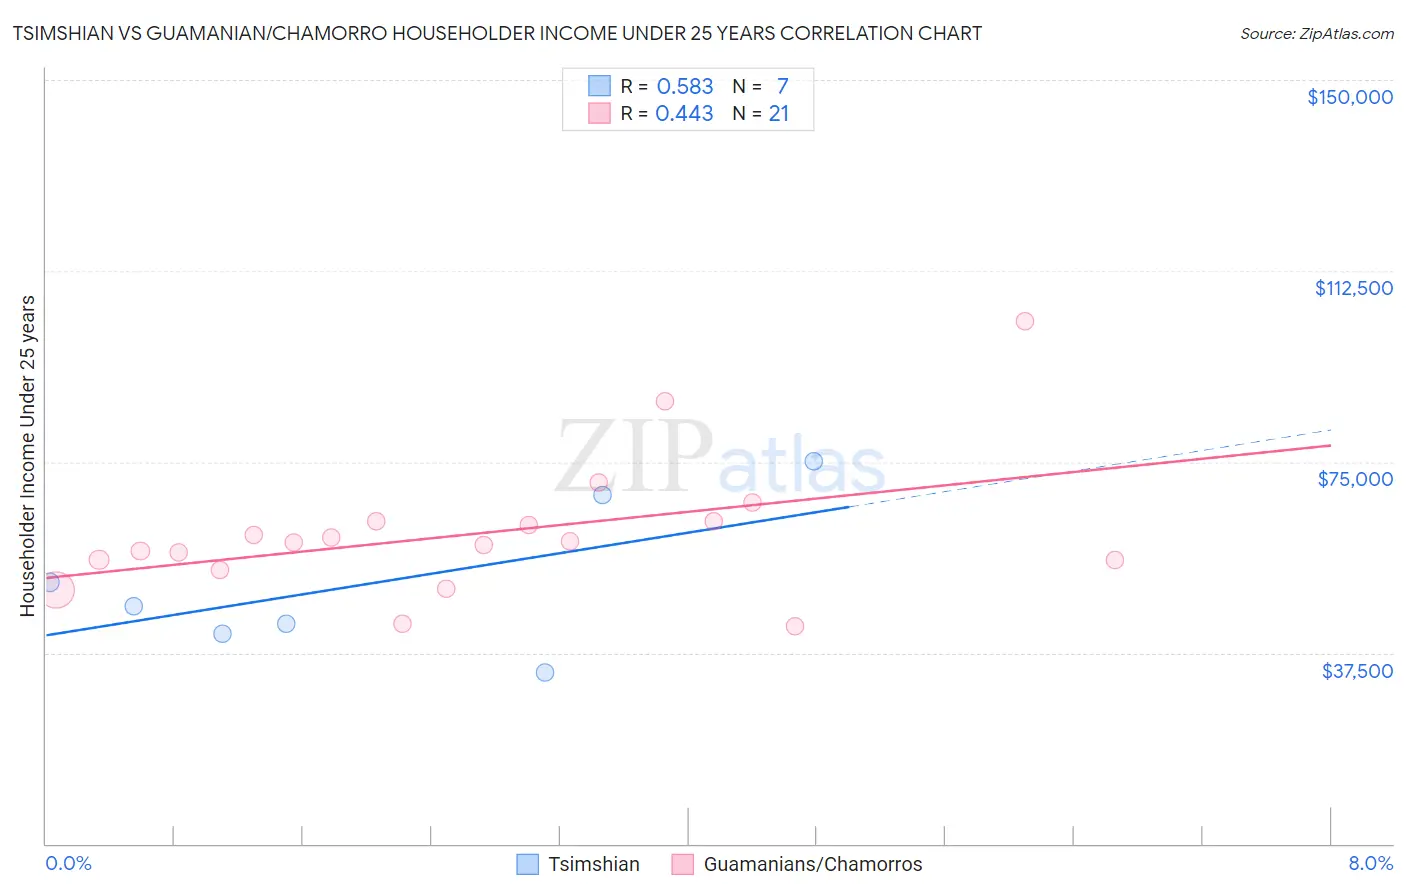
Tsimshian vs Guamanian/Chamorro Householder Income Under 25 years Correlation Chart
The statistical analysis conducted on geographies consisting of 15,054,955 people shows a substantial positive correlation between the proportion of Tsimshian and household income with householder under the age of 25 in the United States with a correlation coefficient (R) of 0.583 and weighted average of $54,649. Similarly, the statistical analysis conducted on geographies consisting of 200,760,858 people shows a moderate positive correlation between the proportion of Guamanians/Chamorros and household income with householder under the age of 25 in the United States with a correlation coefficient (R) of 0.443 and weighted average of $53,423, a difference of 2.3%.
Householder Income Under 25 years Correlation Summary
| Measurement | Tsimshian | Guamanian/Chamorro |
| Minimum | $33,750 | $42,829 |
| Maximum | $75,104 | $102,571 |
| Range | $41,354 | $59,742 |
| Mean | $51,392 | $60,959 |
| Median | $46,717 | $59,082 |
| Interquartile 25% (IQ1) | $41,250 | $54,739 |
| Interquartile 75% (IQ3) | $68,393 | $63,324 |
| Interquartile Range (IQR) | $27,143 | $8,585 |
| Standard Deviation (Sample) | $15,031 | $13,387 |
| Standard Deviation (Population) | $13,916 | $13,064 |
Similar Demographics by Householder Income Under 25 years
Demographics Similar to Tsimshian by Householder Income Under 25 years
In terms of householder income under 25 years, the demographic groups most similar to Tsimshian are Samoan ($54,610, a difference of 0.070%), Immigrants from El Salvador ($54,599, a difference of 0.090%), Okinawan ($54,701, a difference of 0.10%), Immigrants from Morocco ($54,593, a difference of 0.10%), and Immigrants from Bangladesh ($54,714, a difference of 0.12%).
| Demographics | Rating | Rank | Householder Income Under 25 years |
| Immigrants | Europe | 99.9 /100 | #61 | Exceptional $55,022 |
| Immigrants | Uzbekistan | 99.8 /100 | #62 | Exceptional $54,846 |
| Immigrants | Belgium | 99.8 /100 | #63 | Exceptional $54,830 |
| Burmese | 99.8 /100 | #64 | Exceptional $54,800 |
| Yup'ik | 99.8 /100 | #65 | Exceptional $54,732 |
| Immigrants | Bangladesh | 99.8 /100 | #66 | Exceptional $54,714 |
| Okinawans | 99.8 /100 | #67 | Exceptional $54,701 |
| Tsimshian | 99.8 /100 | #68 | Exceptional $54,649 |
| Samoans | 99.7 /100 | #69 | Exceptional $54,610 |
| Immigrants | El Salvador | 99.7 /100 | #70 | Exceptional $54,599 |
| Immigrants | Morocco | 99.7 /100 | #71 | Exceptional $54,593 |
| Immigrants | Northern Europe | 99.7 /100 | #72 | Exceptional $54,571 |
| Macedonians | 99.7 /100 | #73 | Exceptional $54,563 |
| Immigrants | Grenada | 99.7 /100 | #74 | Exceptional $54,538 |
| Immigrants | Sri Lanka | 99.7 /100 | #75 | Exceptional $54,512 |
Demographics Similar to Guamanians/Chamorros by Householder Income Under 25 years
In terms of householder income under 25 years, the demographic groups most similar to Guamanians/Chamorros are Italian ($53,426, a difference of 0.010%), Immigrants from Canada ($53,411, a difference of 0.020%), Immigrants from Ethiopia ($53,408, a difference of 0.030%), Immigrants from Iraq ($53,384, a difference of 0.070%), and Colombian ($53,357, a difference of 0.12%).
| Demographics | Rating | Rank | Householder Income Under 25 years |
| Romanians | 97.2 /100 | #113 | Exceptional $53,632 |
| Immigrants | Sweden | 97.1 /100 | #114 | Exceptional $53,621 |
| Immigrants | Albania | 96.9 /100 | #115 | Exceptional $53,597 |
| Immigrants | Spain | 96.6 /100 | #116 | Exceptional $53,560 |
| Lithuanians | 96.6 /100 | #117 | Exceptional $53,552 |
| Immigrants | Switzerland | 96.3 /100 | #118 | Exceptional $53,528 |
| Italians | 95.4 /100 | #119 | Exceptional $53,426 |
| Guamanians/Chamorros | 95.3 /100 | #120 | Exceptional $53,423 |
| Immigrants | Canada | 95.2 /100 | #121 | Exceptional $53,411 |
| Immigrants | Ethiopia | 95.2 /100 | #122 | Exceptional $53,408 |
| Immigrants | Iraq | 94.9 /100 | #123 | Exceptional $53,384 |
| Colombians | 94.6 /100 | #124 | Exceptional $53,357 |
| Pakistanis | 94.1 /100 | #125 | Exceptional $53,325 |
| Immigrants | Serbia | 94.1 /100 | #126 | Exceptional $53,321 |
| Immigrants | North America | 93.9 /100 | #127 | Exceptional $53,307 |