Tsimshian vs Iranian Householder Income Under 25 years
COMPARE
Tsimshian
Iranian
Householder Income Under 25 years
Householder Income Under 25 years Comparison
Tsimshian
Iranians
$54,649
HOUSEHOLDER INCOME UNDER 25 YEARS
99.8/ 100
METRIC RATING
68th/ 347
METRIC RANK
$55,548
HOUSEHOLDER INCOME UNDER 25 YEARS
100.0/ 100
METRIC RATING
49th/ 347
METRIC RANK
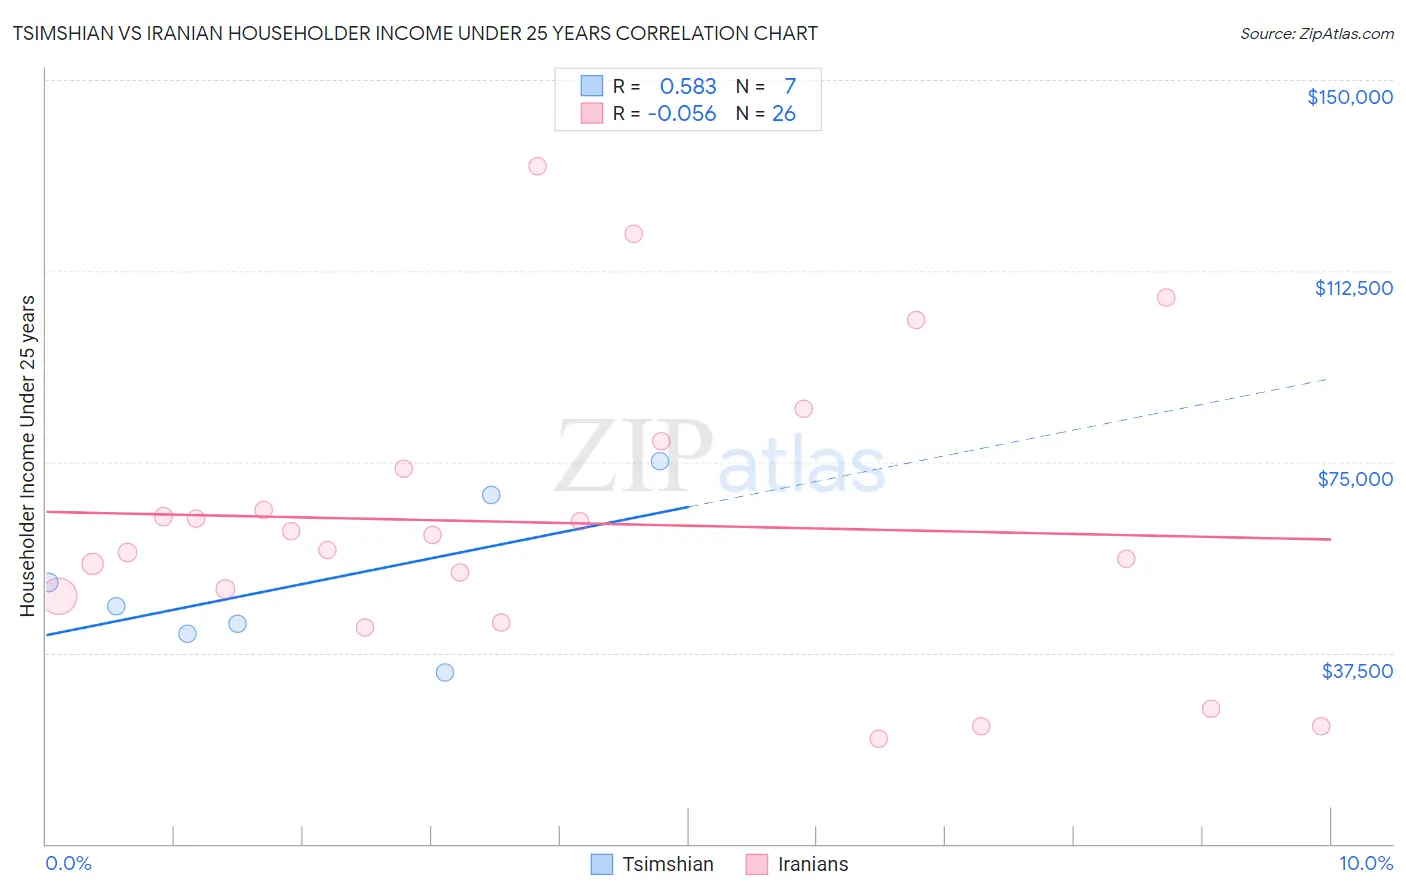
Tsimshian vs Iranian Householder Income Under 25 years Correlation Chart
The statistical analysis conducted on geographies consisting of 15,054,955 people shows a substantial positive correlation between the proportion of Tsimshian and household income with householder under the age of 25 in the United States with a correlation coefficient (R) of 0.583 and weighted average of $54,649. Similarly, the statistical analysis conducted on geographies consisting of 273,572,595 people shows a slight negative correlation between the proportion of Iranians and household income with householder under the age of 25 in the United States with a correlation coefficient (R) of -0.056 and weighted average of $55,548, a difference of 1.7%.
Householder Income Under 25 years Correlation Summary
| Measurement | Tsimshian | Iranian |
| Minimum | $33,750 | $20,584 |
| Maximum | $75,104 | $133,071 |
| Range | $41,354 | $112,487 |
| Mean | $51,392 | $62,988 |
| Median | $46,717 | $59,129 |
| Interquartile 25% (IQ1) | $41,250 | $48,552 |
| Interquartile 75% (IQ3) | $68,393 | $73,761 |
| Interquartile Range (IQR) | $27,143 | $25,209 |
| Standard Deviation (Sample) | $15,031 | $28,528 |
| Standard Deviation (Population) | $13,916 | $27,974 |
Demographics Similar to Tsimshian and Iranians by Householder Income Under 25 years
In terms of householder income under 25 years, the demographic groups most similar to Tsimshian are Okinawan ($54,701, a difference of 0.10%), Immigrants from Bangladesh ($54,714, a difference of 0.12%), Yup'ik ($54,732, a difference of 0.15%), Burmese ($54,800, a difference of 0.28%), and Immigrants from Belgium ($54,830, a difference of 0.33%). Similarly, the demographic groups most similar to Iranians are Puget Sound Salish ($55,543, a difference of 0.010%), Immigrants from Vietnam ($55,562, a difference of 0.030%), Immigrants from Romania ($55,522, a difference of 0.050%), Immigrants from Indonesia ($55,521, a difference of 0.050%), and Immigrants from Poland ($55,474, a difference of 0.13%).
| Demographics | Rating | Rank | Householder Income Under 25 years |
| Immigrants | Vietnam | 100.0 /100 | #48 | Exceptional $55,562 |
| Iranians | 100.0 /100 | #49 | Exceptional $55,548 |
| Puget Sound Salish | 100.0 /100 | #50 | Exceptional $55,543 |
| Immigrants | Romania | 100.0 /100 | #51 | Exceptional $55,522 |
| Immigrants | Indonesia | 100.0 /100 | #52 | Exceptional $55,521 |
| Immigrants | Poland | 100.0 /100 | #53 | Exceptional $55,474 |
| Sri Lankans | 100.0 /100 | #54 | Exceptional $55,470 |
| Immigrants | Ukraine | 100.0 /100 | #55 | Exceptional $55,447 |
| Salvadorans | 100.0 /100 | #56 | Exceptional $55,412 |
| Soviet Union | 100.0 /100 | #57 | Exceptional $55,340 |
| Guyanese | 99.9 /100 | #58 | Exceptional $55,210 |
| Native Hawaiians | 99.9 /100 | #59 | Exceptional $55,158 |
| Immigrants | Lithuania | 99.9 /100 | #60 | Exceptional $55,028 |
| Immigrants | Europe | 99.9 /100 | #61 | Exceptional $55,022 |
| Immigrants | Uzbekistan | 99.8 /100 | #62 | Exceptional $54,846 |
| Immigrants | Belgium | 99.8 /100 | #63 | Exceptional $54,830 |
| Burmese | 99.8 /100 | #64 | Exceptional $54,800 |
| Yup'ik | 99.8 /100 | #65 | Exceptional $54,732 |
| Immigrants | Bangladesh | 99.8 /100 | #66 | Exceptional $54,714 |
| Okinawans | 99.8 /100 | #67 | Exceptional $54,701 |
| Tsimshian | 99.8 /100 | #68 | Exceptional $54,649 |