Tsimshian vs Immigrants from Argentina Householder Income Under 25 years
COMPARE
Tsimshian
Immigrants from Argentina
Householder Income Under 25 years
Householder Income Under 25 years Comparison
Tsimshian
Immigrants from Argentina
$54,649
HOUSEHOLDER INCOME UNDER 25 YEARS
99.8/ 100
METRIC RATING
68th/ 347
METRIC RANK
$54,209
HOUSEHOLDER INCOME UNDER 25 YEARS
99.3/ 100
METRIC RATING
93rd/ 347
METRIC RANK
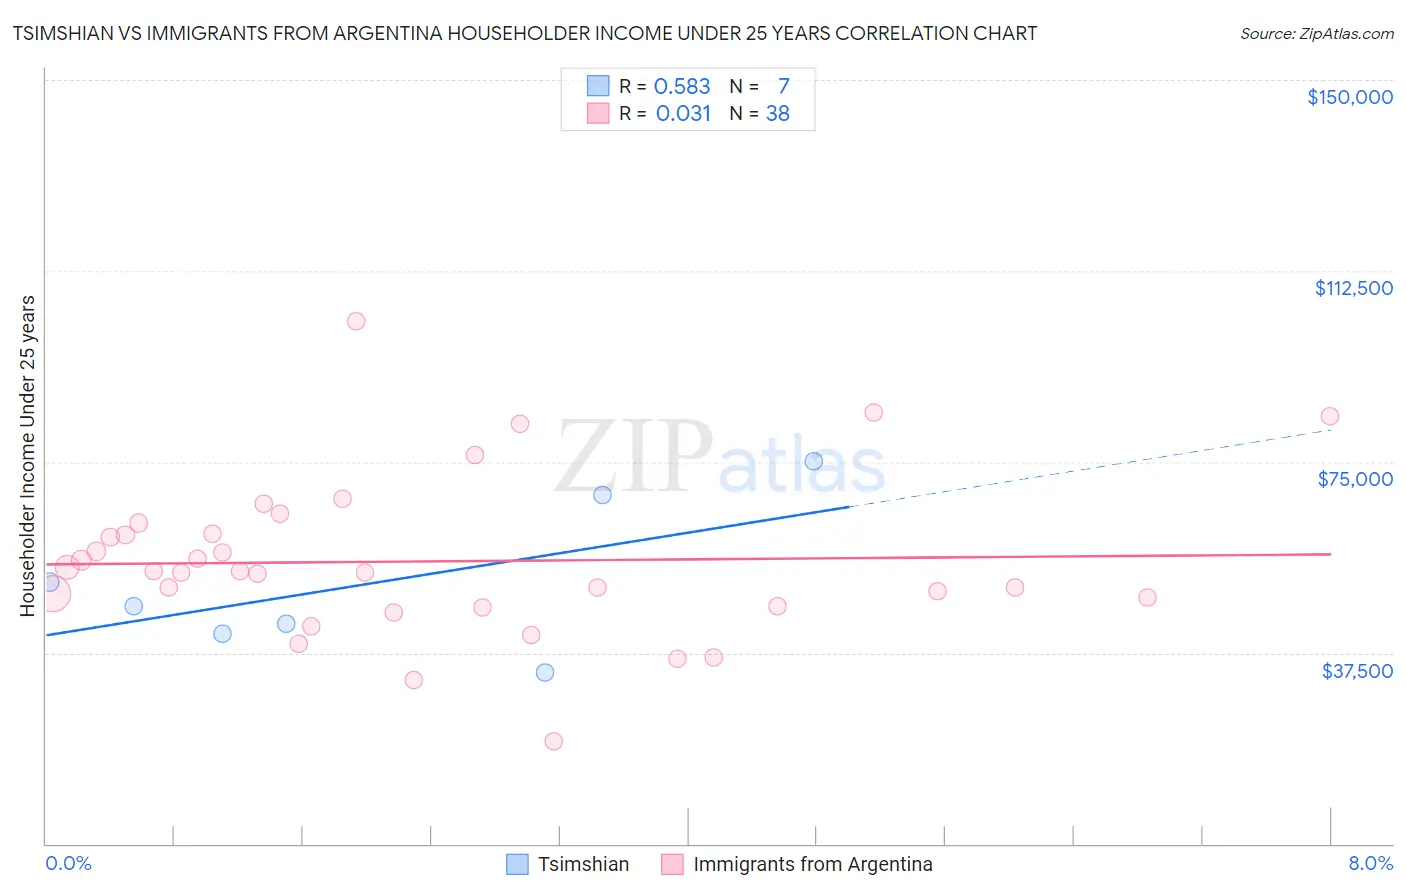
Tsimshian vs Immigrants from Argentina Householder Income Under 25 years Correlation Chart
The statistical analysis conducted on geographies consisting of 15,054,955 people shows a substantial positive correlation between the proportion of Tsimshian and household income with householder under the age of 25 in the United States with a correlation coefficient (R) of 0.583 and weighted average of $54,649. Similarly, the statistical analysis conducted on geographies consisting of 229,141,308 people shows no correlation between the proportion of Immigrants from Argentina and household income with householder under the age of 25 in the United States with a correlation coefficient (R) of 0.031 and weighted average of $54,209, a difference of 0.81%.
Householder Income Under 25 years Correlation Summary
| Measurement | Tsimshian | Immigrants from Argentina |
| Minimum | $33,750 | $20,094 |
| Maximum | $75,104 | $102,571 |
| Range | $41,354 | $82,477 |
| Mean | $51,392 | $55,432 |
| Median | $46,717 | $53,374 |
| Interquartile 25% (IQ1) | $41,250 | $46,727 |
| Interquartile 75% (IQ3) | $68,393 | $60,828 |
| Interquartile Range (IQR) | $27,143 | $14,101 |
| Standard Deviation (Sample) | $15,031 | $15,762 |
| Standard Deviation (Population) | $13,916 | $15,553 |
Similar Demographics by Householder Income Under 25 years
Demographics Similar to Tsimshian by Householder Income Under 25 years
In terms of householder income under 25 years, the demographic groups most similar to Tsimshian are Samoan ($54,610, a difference of 0.070%), Immigrants from El Salvador ($54,599, a difference of 0.090%), Okinawan ($54,701, a difference of 0.10%), Immigrants from Morocco ($54,593, a difference of 0.10%), and Immigrants from Bangladesh ($54,714, a difference of 0.12%).
| Demographics | Rating | Rank | Householder Income Under 25 years |
| Immigrants | Europe | 99.9 /100 | #61 | Exceptional $55,022 |
| Immigrants | Uzbekistan | 99.8 /100 | #62 | Exceptional $54,846 |
| Immigrants | Belgium | 99.8 /100 | #63 | Exceptional $54,830 |
| Burmese | 99.8 /100 | #64 | Exceptional $54,800 |
| Yup'ik | 99.8 /100 | #65 | Exceptional $54,732 |
| Immigrants | Bangladesh | 99.8 /100 | #66 | Exceptional $54,714 |
| Okinawans | 99.8 /100 | #67 | Exceptional $54,701 |
| Tsimshian | 99.8 /100 | #68 | Exceptional $54,649 |
| Samoans | 99.7 /100 | #69 | Exceptional $54,610 |
| Immigrants | El Salvador | 99.7 /100 | #70 | Exceptional $54,599 |
| Immigrants | Morocco | 99.7 /100 | #71 | Exceptional $54,593 |
| Immigrants | Northern Europe | 99.7 /100 | #72 | Exceptional $54,571 |
| Macedonians | 99.7 /100 | #73 | Exceptional $54,563 |
| Immigrants | Grenada | 99.7 /100 | #74 | Exceptional $54,538 |
| Immigrants | Sri Lanka | 99.7 /100 | #75 | Exceptional $54,512 |
Demographics Similar to Immigrants from Argentina by Householder Income Under 25 years
In terms of householder income under 25 years, the demographic groups most similar to Immigrants from Argentina are Immigrants from Sierra Leone ($54,190, a difference of 0.030%), Immigrants from St. Vincent and the Grenadines ($54,230, a difference of 0.040%), Immigrants from Egypt ($54,239, a difference of 0.050%), Immigrants from Malaysia ($54,179, a difference of 0.050%), and Turkish ($54,266, a difference of 0.10%).
| Demographics | Rating | Rank | Householder Income Under 25 years |
| Immigrants | Croatia | 99.5 /100 | #86 | Exceptional $54,343 |
| Brazilians | 99.5 /100 | #87 | Exceptional $54,335 |
| Yakama | 99.5 /100 | #88 | Exceptional $54,321 |
| Immigrants | South America | 99.4 /100 | #89 | Exceptional $54,268 |
| Turks | 99.4 /100 | #90 | Exceptional $54,266 |
| Immigrants | Egypt | 99.3 /100 | #91 | Exceptional $54,239 |
| Immigrants | St. Vincent and the Grenadines | 99.3 /100 | #92 | Exceptional $54,230 |
| Immigrants | Argentina | 99.3 /100 | #93 | Exceptional $54,209 |
| Immigrants | Sierra Leone | 99.3 /100 | #94 | Exceptional $54,190 |
| Immigrants | Malaysia | 99.2 /100 | #95 | Exceptional $54,179 |
| Argentineans | 99.2 /100 | #96 | Exceptional $54,154 |
| Immigrants | Portugal | 99.1 /100 | #97 | Exceptional $54,105 |
| Eastern Europeans | 99.0 /100 | #98 | Exceptional $54,066 |
| Alaska Natives | 98.8 /100 | #99 | Exceptional $54,000 |
| Immigrants | Kazakhstan | 98.8 /100 | #100 | Exceptional $53,990 |