Tlingit-Haida vs Barbadian Per Capita Income
COMPARE
Tlingit-Haida
Barbadian
Per Capita Income
Per Capita Income Comparison
Tlingit-Haida
Barbadians
$43,516
PER CAPITA INCOME
45.9/ 100
METRIC RATING
177th/ 347
METRIC RANK
$42,406
PER CAPITA INCOME
19.6/ 100
METRIC RATING
199th/ 347
METRIC RANK
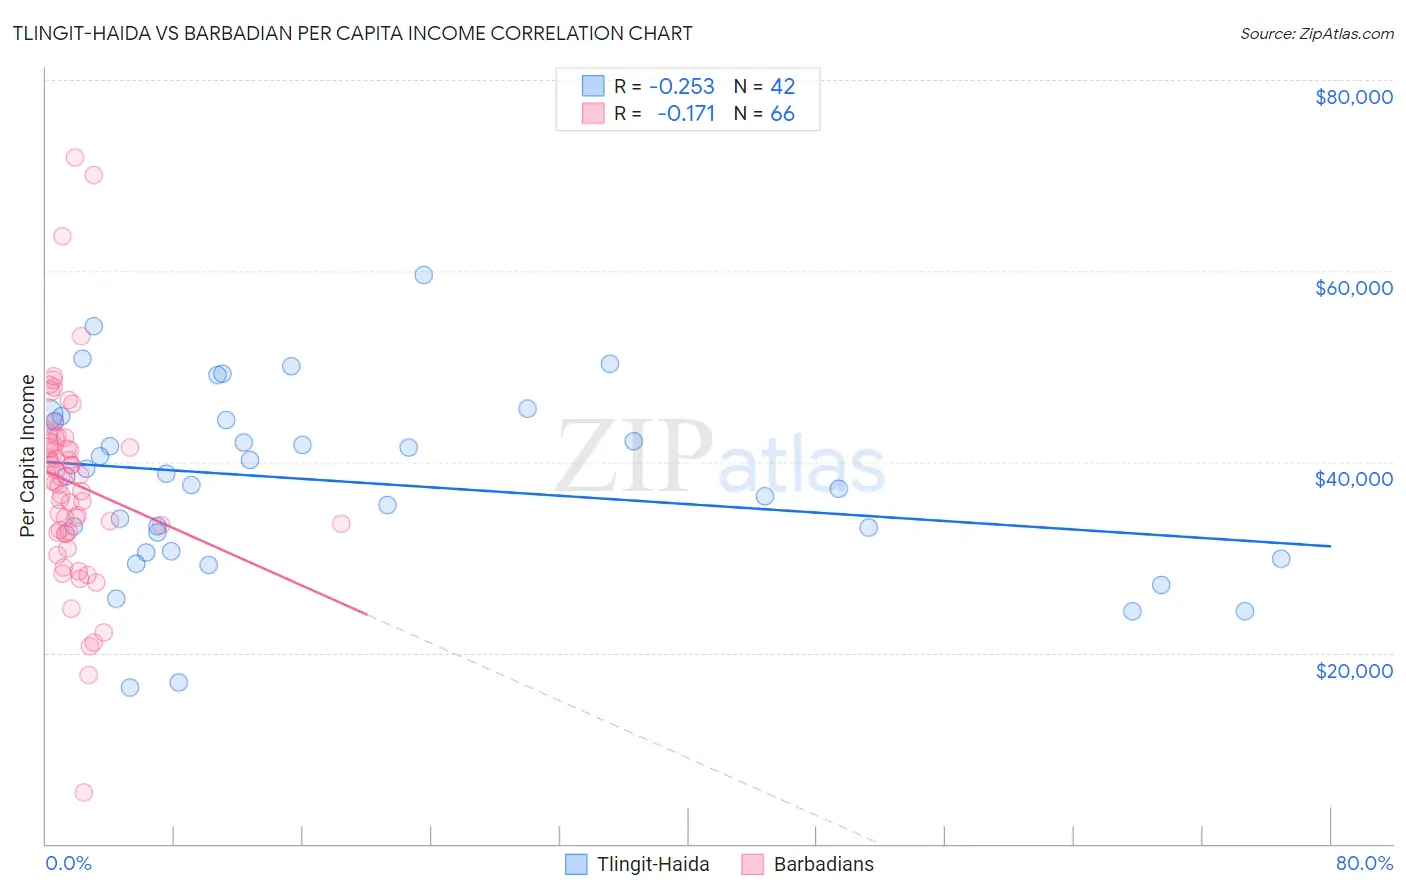
Tlingit-Haida vs Barbadian Per Capita Income Correlation Chart
The statistical analysis conducted on geographies consisting of 60,872,339 people shows a weak negative correlation between the proportion of Tlingit-Haida and per capita income in the United States with a correlation coefficient (R) of -0.253 and weighted average of $43,516. Similarly, the statistical analysis conducted on geographies consisting of 141,304,082 people shows a poor negative correlation between the proportion of Barbadians and per capita income in the United States with a correlation coefficient (R) of -0.171 and weighted average of $42,406, a difference of 2.6%.
Per Capita Income Correlation Summary
| Measurement | Tlingit-Haida | Barbadian |
| Minimum | $16,326 | $5,324 |
| Maximum | $59,619 | $71,926 |
| Range | $43,293 | $66,602 |
| Mean | $37,894 | $37,719 |
| Median | $38,682 | $37,906 |
| Interquartile 25% (IQ1) | $30,599 | $32,556 |
| Interquartile 75% (IQ3) | $44,372 | $41,973 |
| Interquartile Range (IQR) | $13,773 | $9,418 |
| Standard Deviation (Sample) | $9,586 | $10,673 |
| Standard Deviation (Population) | $9,471 | $10,592 |
Similar Demographics by Per Capita Income
Demographics Similar to Tlingit-Haida by Per Capita Income
In terms of per capita income, the demographic groups most similar to Tlingit-Haida are Immigrants from South Eastern Asia ($43,539, a difference of 0.050%), Immigrants from Costa Rica ($43,464, a difference of 0.12%), Finnish ($43,461, a difference of 0.13%), Celtic ($43,621, a difference of 0.24%), and Sierra Leonean ($43,405, a difference of 0.25%).
| Demographics | Rating | Rank | Per Capita Income |
| Scandinavians | 55.2 /100 | #170 | Average $43,848 |
| Immigrants | Eastern Africa | 54.9 /100 | #171 | Average $43,838 |
| Czechoslovakians | 54.1 /100 | #172 | Average $43,806 |
| French | 50.7 /100 | #173 | Average $43,685 |
| Colombians | 50.0 /100 | #174 | Average $43,661 |
| Celtics | 48.9 /100 | #175 | Average $43,621 |
| Immigrants | South Eastern Asia | 46.6 /100 | #176 | Average $43,539 |
| Tlingit-Haida | 45.9 /100 | #177 | Average $43,516 |
| Immigrants | Costa Rica | 44.5 /100 | #178 | Average $43,464 |
| Finns | 44.4 /100 | #179 | Average $43,461 |
| Sierra Leoneans | 42.9 /100 | #180 | Average $43,405 |
| Welsh | 38.2 /100 | #181 | Fair $43,233 |
| Immigrants | Vietnam | 38.1 /100 | #182 | Fair $43,229 |
| Germans | 33.9 /100 | #183 | Fair $43,067 |
| Spaniards | 32.9 /100 | #184 | Fair $43,028 |
Demographics Similar to Barbadians by Per Capita Income
In terms of per capita income, the demographic groups most similar to Barbadians are Immigrants from Portugal ($42,412, a difference of 0.010%), Vietnamese ($42,368, a difference of 0.090%), Immigrants from Thailand ($42,289, a difference of 0.28%), Immigrants from Bosnia and Herzegovina ($42,278, a difference of 0.30%), and Scotch-Irish ($42,563, a difference of 0.37%).
| Demographics | Rating | Rank | Per Capita Income |
| Iraqis | 26.7 /100 | #192 | Fair $42,760 |
| Immigrants | Sierra Leone | 26.5 /100 | #193 | Fair $42,752 |
| Immigrants | Fiji | 25.2 /100 | #194 | Fair $42,694 |
| Immigrants | Kenya | 24.5 /100 | #195 | Fair $42,661 |
| Dutch | 23.4 /100 | #196 | Fair $42,605 |
| Scotch-Irish | 22.6 /100 | #197 | Fair $42,563 |
| Immigrants | Portugal | 19.7 /100 | #198 | Poor $42,412 |
| Barbadians | 19.6 /100 | #199 | Poor $42,406 |
| Vietnamese | 19.0 /100 | #200 | Poor $42,368 |
| Immigrants | Thailand | 17.6 /100 | #201 | Poor $42,289 |
| Immigrants | Bosnia and Herzegovina | 17.5 /100 | #202 | Poor $42,278 |
| Spanish | 17.0 /100 | #203 | Poor $42,249 |
| Aleuts | 16.4 /100 | #204 | Poor $42,210 |
| Whites/Caucasians | 15.9 /100 | #205 | Poor $42,180 |
| Ghanaians | 15.7 /100 | #206 | Poor $42,164 |