Tlingit-Haida Per Capita Income
COMPARE
Tlingit-Haida
Select to Compare
Per Capita Income
Tlingit-Haida Per Capita Income
$43,516
PER CAPITA INCOME
45.9/ 100
METRIC RATING
177th/ 347
METRIC RANK
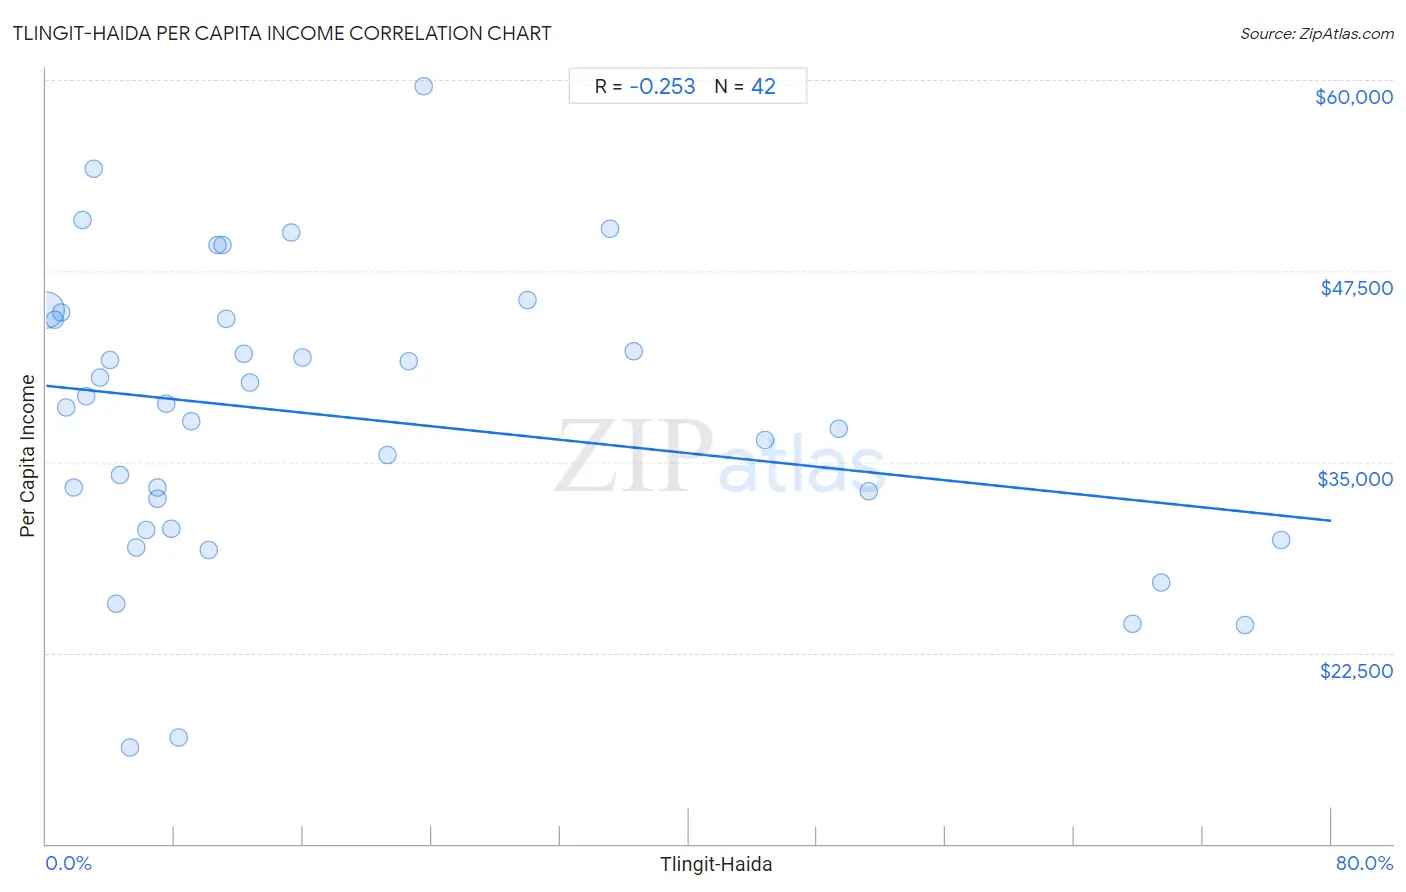
Tlingit-Haida Per Capita Income Correlation Chart
The statistical analysis conducted on geographies consisting of 60,872,339 people shows a weak negative correlation between the proportion of Tlingit-Haida and per capita income in the United States with a correlation coefficient (R) of -0.253 and weighted average of $43,516. On average, for every 1% (one percent) increase in Tlingit-Haida within a typical geography, there is a decrease of $110 in per capita income.
It is essential to understand that the correlation between the percentage of Tlingit-Haida and per capita income does not imply a direct cause-and-effect relationship. It remains uncertain whether the presence of Tlingit-Haida influences an upward or downward trend in the level of per capita income within an area, or if Tlingit-Haida simply ended up residing in those areas with higher or lower levels of per capita income due to other factors.
Demographics Similar to Tlingit-Haida by Per Capita Income
In terms of per capita income, the demographic groups most similar to Tlingit-Haida are Immigrants from South Eastern Asia ($43,539, a difference of 0.050%), Immigrants from Costa Rica ($43,464, a difference of 0.12%), Finnish ($43,461, a difference of 0.13%), Celtic ($43,621, a difference of 0.24%), and Sierra Leonean ($43,405, a difference of 0.25%).
| Demographics | Rating | Rank | Per Capita Income |
| Scandinavians | 55.2 /100 | #170 | Average $43,848 |
| Immigrants from Eastern Africa | 54.9 /100 | #171 | Average $43,838 |
| Czechoslovakians | 54.1 /100 | #172 | Average $43,806 |
| French | 50.7 /100 | #173 | Average $43,685 |
| Colombians | 50.0 /100 | #174 | Average $43,661 |
| Celtics | 48.9 /100 | #175 | Average $43,621 |
| Immigrants from South Eastern Asia | 46.6 /100 | #176 | Average $43,539 |
| Tlingit-Haida | 45.9 /100 | #177 | Average $43,516 |
| Immigrants from Costa Rica | 44.5 /100 | #178 | Average $43,464 |
| Finns | 44.4 /100 | #179 | Average $43,461 |
| Sierra Leoneans | 42.9 /100 | #180 | Average $43,405 |
| Welsh | 38.2 /100 | #181 | Fair $43,233 |
| Immigrants from Vietnam | 38.1 /100 | #182 | Fair $43,229 |
| Germans | 33.9 /100 | #183 | Fair $43,067 |
| Spaniards | 32.9 /100 | #184 | Fair $43,028 |
Tlingit-Haida Per Capita Income Correlation Summary
| Measurement | Tlingit-Haida Data | Per Capita Income Data |
| Minimum | 0.036% | $16,326 |
| Maximum | 76.8% | $59,619 |
| Range | 76.8% | $43,293 |
| Mean | 18.9% | $37,894 |
| Median | 9.6% | $38,682 |
| Interquartile 25% (IQ1) | 4.3% | $30,599 |
| Interquartile 75% (IQ3) | 23.5% | $44,372 |
| Interquartile Range (IQR) | 19.2% | $13,773 |
| Standard Deviation (Sample) | 21.9% | $9,586 |
| Standard Deviation (Population) | 21.7% | $9,471 |
Correlation Details
| Tlingit-Haida Percentile | Sample Size | Per Capita Income |
[ 0.0% - 0.5% ] 0.036% | 59,033,062 | $44,973 |
[ 0.5% - 1.0% ] 0.54% | 1,312,339 | $44,285 |
[ 0.5% - 1.0% ] 0.91% | 247,818 | $44,796 |
[ 1.0% - 1.5% ] 1.24% | 85,687 | $38,545 |
[ 1.5% - 2.0% ] 1.71% | 25,685 | $33,312 |
[ 2.0% - 2.5% ] 2.28% | 8,447 | $50,834 |
[ 2.0% - 2.5% ] 2.46% | 3,821 | $39,301 |
[ 2.5% - 3.0% ] 2.92% | 6,472 | $54,224 |
[ 3.0% - 3.5% ] 3.33% | 10,388 | $40,547 |
[ 3.5% - 4.0% ] 3.97% | 1,964 | $41,694 |
[ 4.0% - 4.5% ] 4.35% | 115 | $25,695 |
[ 4.5% - 5.0% ] 4.62% | 822 | $34,100 |
[ 5.0% - 5.5% ] 5.24% | 420 | $16,326 |
[ 5.5% - 6.0% ] 5.62% | 1,762 | $29,388 |
[ 6.0% - 6.5% ] 6.21% | 177 | $30,561 |
[ 6.5% - 7.0% ] 6.91% | 564 | $32,548 |
[ 6.5% - 7.0% ] 6.94% | 2,146 | $33,296 |
[ 7.0% - 7.5% ] 7.50% | 40 | $38,820 |
[ 7.5% - 8.0% ] 7.80% | 1,257 | $30,599 |
[ 8.0% - 8.5% ] 8.22% | 146 | $16,915 |
[ 8.5% - 9.0% ] 9.00% | 6,691 | $37,637 |
[ 10.0% - 10.5% ] 10.13% | 2,902 | $29,238 |
[ 10.5% - 11.0% ] 10.70% | 29,933 | $49,160 |
[ 11.0% - 11.5% ] 11.00% | 32,108 | $49,207 |
[ 11.0% - 11.5% ] 11.18% | 13,913 | $44,372 |
[ 12.0% - 12.5% ] 12.26% | 18,041 | $42,062 |
[ 12.5% - 13.0% ] 12.66% | 8,647 | $40,232 |
[ 15.0% - 15.5% ] 15.26% | 2,169 | $49,982 |
[ 15.5% - 16.0% ] 15.92% | 1,727 | $41,827 |
[ 21.0% - 21.5% ] 21.23% | 4,267 | $35,427 |
[ 22.5% - 23.0% ] 22.55% | 1,073 | $41,566 |
[ 23.5% - 24.0% ] 23.53% | 85 | $59,619 |
[ 29.5% - 30.0% ] 29.96% | 1,128 | $45,578 |
[ 35.0% - 35.5% ] 35.09% | 57 | $50,277 |
[ 36.5% - 37.0% ] 36.59% | 82 | $42,202 |
[ 44.5% - 45.0% ] 44.78% | 920 | $36,414 |
[ 49.0% - 49.5% ] 49.33% | 1,792 | $37,151 |
[ 51.0% - 51.5% ] 51.24% | 804 | $33,116 |
[ 67.5% - 68.0% ] 67.59% | 361 | $24,381 |
[ 69.0% - 69.5% ] 69.41% | 1,602 | $27,124 |
[ 74.5% - 75.0% ] 74.63% | 67 | $24,327 |
[ 76.5% - 77.0% ] 76.85% | 838 | $29,872 |