Tlingit-Haida vs Immigrants from Nepal Median Family Income
COMPARE
Tlingit-Haida
Immigrants from Nepal
Median Family Income
Median Family Income Comparison
Tlingit-Haida
Immigrants from Nepal
$101,092
MEDIAN FAMILY INCOME
30.8/ 100
METRIC RATING
187th/ 347
METRIC RANK
$104,966
MEDIAN FAMILY INCOME
76.3/ 100
METRIC RATING
154th/ 347
METRIC RANK
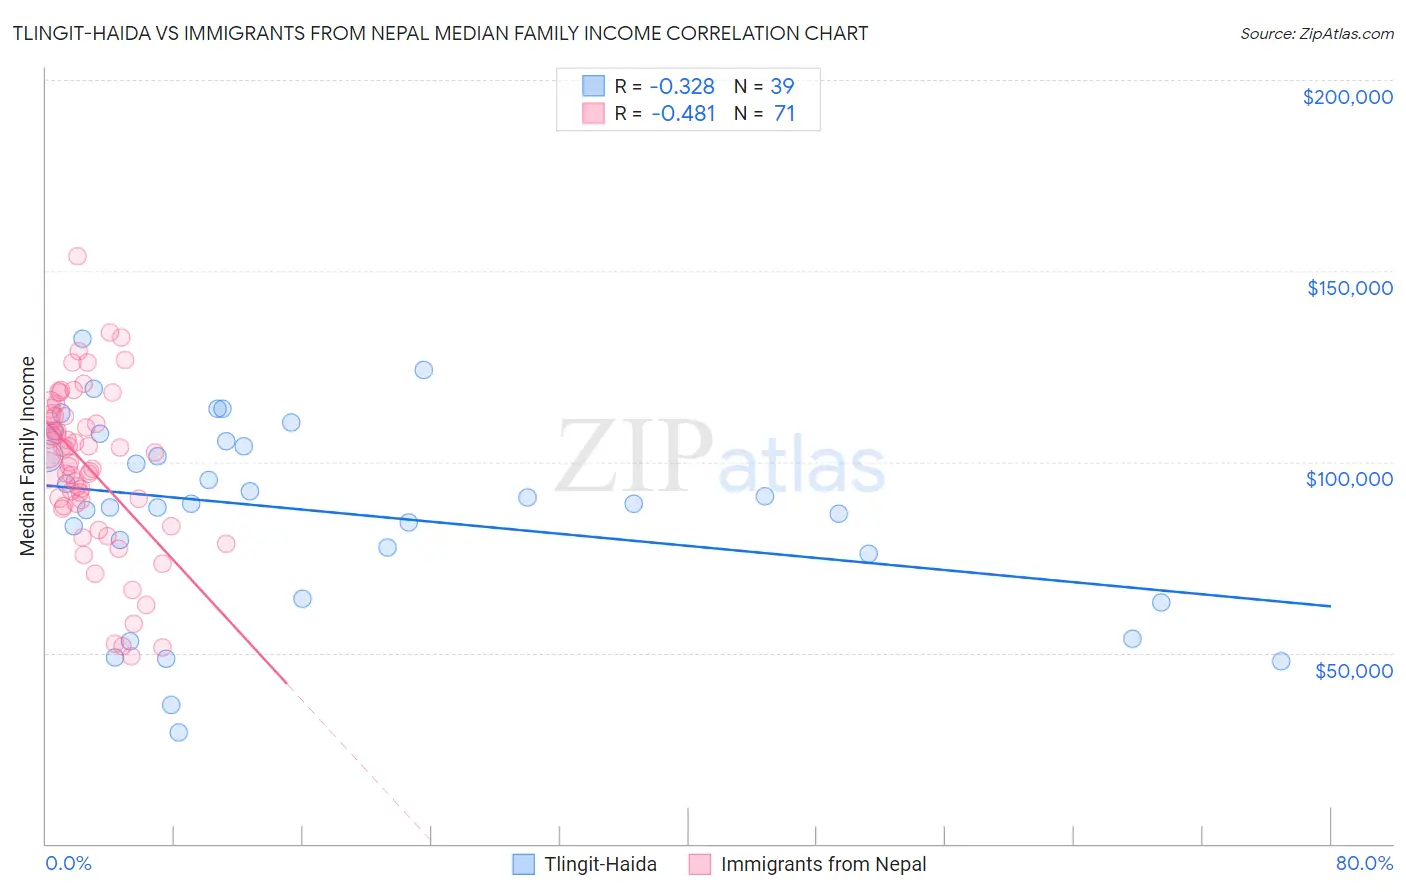
Tlingit-Haida vs Immigrants from Nepal Median Family Income Correlation Chart
The statistical analysis conducted on geographies consisting of 60,853,273 people shows a mild negative correlation between the proportion of Tlingit-Haida and median family income in the United States with a correlation coefficient (R) of -0.328 and weighted average of $101,092. Similarly, the statistical analysis conducted on geographies consisting of 186,649,398 people shows a moderate negative correlation between the proportion of Immigrants from Nepal and median family income in the United States with a correlation coefficient (R) of -0.481 and weighted average of $104,966, a difference of 3.8%.
Median Family Income Correlation Summary
| Measurement | Tlingit-Haida | Immigrants from Nepal |
| Minimum | $29,250 | $49,167 |
| Maximum | $132,184 | $153,934 |
| Range | $102,934 | $104,767 |
| Mean | $86,951 | $98,602 |
| Median | $88,958 | $101,530 |
| Interquartile 25% (IQ1) | $75,972 | $88,483 |
| Interquartile 75% (IQ3) | $105,493 | $112,054 |
| Interquartile Range (IQR) | $29,521 | $23,571 |
| Standard Deviation (Sample) | $24,804 | $21,122 |
| Standard Deviation (Population) | $24,484 | $20,972 |
Similar Demographics by Median Family Income
Demographics Similar to Tlingit-Haida by Median Family Income
In terms of median family income, the demographic groups most similar to Tlingit-Haida are Guamanian/Chamorro ($101,061, a difference of 0.030%), Celtic ($101,139, a difference of 0.050%), Dutch ($101,192, a difference of 0.10%), Immigrants from Portugal ($100,984, a difference of 0.11%), and Immigrants ($100,962, a difference of 0.13%).
| Demographics | Rating | Rank | Median Family Income |
| French Canadians | 37.0 /100 | #180 | Fair $101,634 |
| Spaniards | 36.8 /100 | #181 | Fair $101,617 |
| Tsimshian | 35.9 /100 | #182 | Fair $101,543 |
| Kenyans | 34.5 /100 | #183 | Fair $101,417 |
| Immigrants | Costa Rica | 33.7 /100 | #184 | Fair $101,354 |
| Dutch | 31.9 /100 | #185 | Fair $101,192 |
| Celtics | 31.3 /100 | #186 | Fair $101,139 |
| Tlingit-Haida | 30.8 /100 | #187 | Fair $101,092 |
| Guamanians/Chamorros | 30.5 /100 | #188 | Fair $101,061 |
| Immigrants | Portugal | 29.6 /100 | #189 | Fair $100,984 |
| Immigrants | Immigrants | 29.4 /100 | #190 | Fair $100,962 |
| Colombians | 27.2 /100 | #191 | Fair $100,750 |
| Immigrants | Kenya | 26.5 /100 | #192 | Fair $100,679 |
| Iraqis | 26.3 /100 | #193 | Fair $100,658 |
| Uruguayans | 26.3 /100 | #194 | Fair $100,656 |
Demographics Similar to Immigrants from Nepal by Median Family Income
In terms of median family income, the demographic groups most similar to Immigrants from Nepal are Native Hawaiian ($104,910, a difference of 0.050%), Slavic ($105,144, a difference of 0.17%), Basque ($104,760, a difference of 0.20%), Immigrants from Albania ($105,285, a difference of 0.30%), and Peruvian ($105,444, a difference of 0.45%).
| Demographics | Rating | Rank | Median Family Income |
| Immigrants | Chile | 82.1 /100 | #147 | Excellent $105,655 |
| Hungarians | 81.7 /100 | #148 | Excellent $105,609 |
| Immigrants | Germany | 80.9 /100 | #149 | Excellent $105,507 |
| Irish | 80.5 /100 | #150 | Excellent $105,453 |
| Peruvians | 80.4 /100 | #151 | Excellent $105,444 |
| Immigrants | Albania | 79.1 /100 | #152 | Good $105,285 |
| Slavs | 77.9 /100 | #153 | Good $105,144 |
| Immigrants | Nepal | 76.3 /100 | #154 | Good $104,966 |
| Native Hawaiians | 75.8 /100 | #155 | Good $104,910 |
| Basques | 74.4 /100 | #156 | Good $104,760 |
| Moroccans | 71.6 /100 | #157 | Good $104,488 |
| Scandinavians | 70.8 /100 | #158 | Good $104,410 |
| Swiss | 70.7 /100 | #159 | Good $104,396 |
| Scottish | 69.5 /100 | #160 | Good $104,288 |
| Icelanders | 69.4 /100 | #161 | Good $104,282 |