Tlingit-Haida vs Slovak Median Family Income
COMPARE
Tlingit-Haida
Slovak
Median Family Income
Median Family Income Comparison
Tlingit-Haida
Slovaks
$101,092
MEDIAN FAMILY INCOME
30.8/ 100
METRIC RATING
187th/ 347
METRIC RANK
$103,729
MEDIAN FAMILY INCOME
63.1/ 100
METRIC RATING
165th/ 347
METRIC RANK
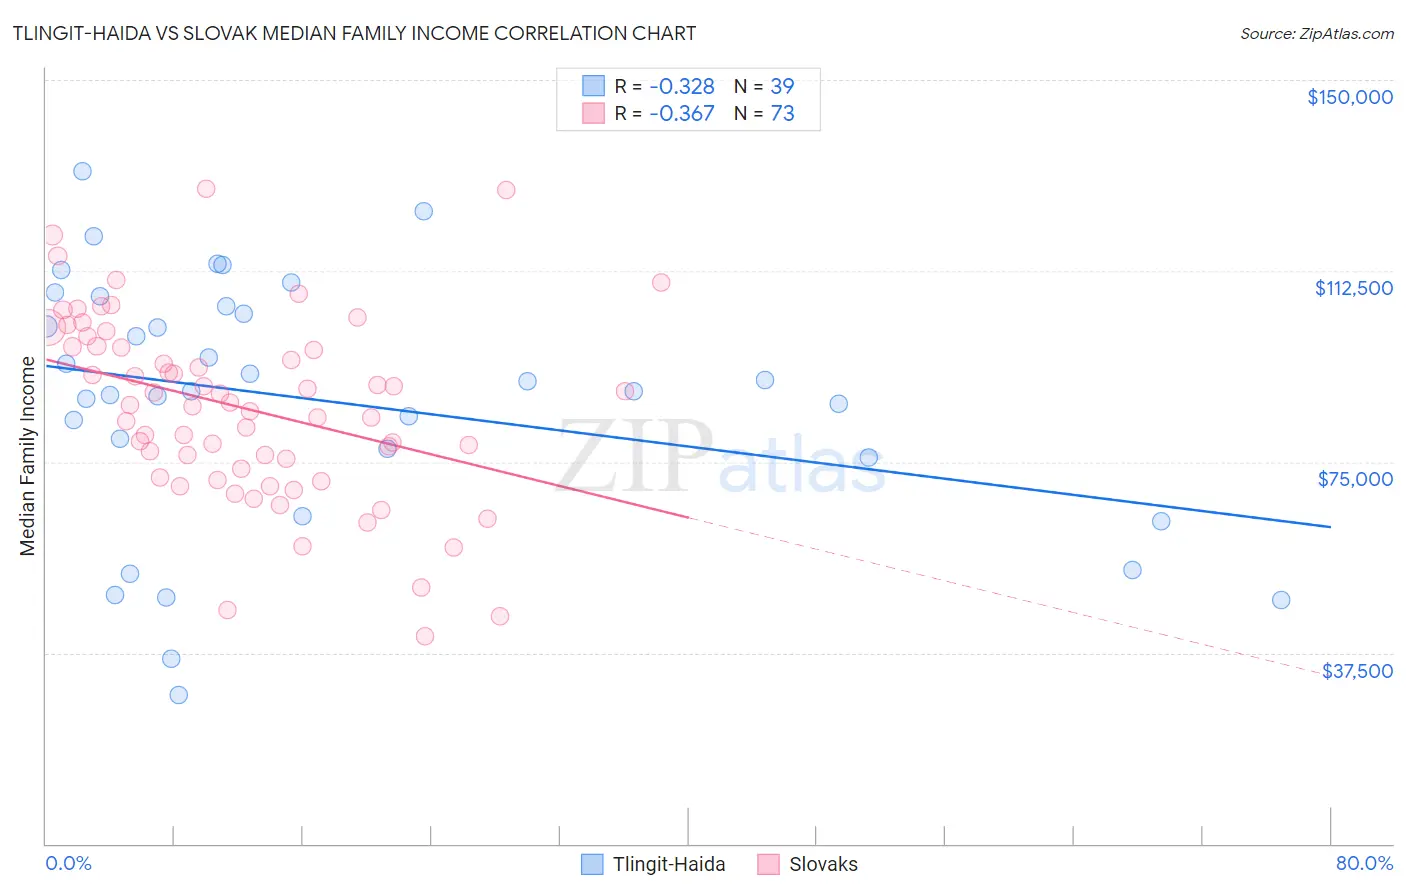
Tlingit-Haida vs Slovak Median Family Income Correlation Chart
The statistical analysis conducted on geographies consisting of 60,853,273 people shows a mild negative correlation between the proportion of Tlingit-Haida and median family income in the United States with a correlation coefficient (R) of -0.328 and weighted average of $101,092. Similarly, the statistical analysis conducted on geographies consisting of 397,537,551 people shows a mild negative correlation between the proportion of Slovaks and median family income in the United States with a correlation coefficient (R) of -0.367 and weighted average of $103,729, a difference of 2.6%.
Median Family Income Correlation Summary
| Measurement | Tlingit-Haida | Slovak |
| Minimum | $29,250 | $40,809 |
| Maximum | $132,184 | $128,732 |
| Range | $102,934 | $87,923 |
| Mean | $86,951 | $85,532 |
| Median | $88,958 | $86,184 |
| Interquartile 25% (IQ1) | $75,972 | $72,785 |
| Interquartile 75% (IQ3) | $105,493 | $97,619 |
| Interquartile Range (IQR) | $29,521 | $24,833 |
| Standard Deviation (Sample) | $24,804 | $18,291 |
| Standard Deviation (Population) | $24,484 | $18,165 |
Similar Demographics by Median Family Income
Demographics Similar to Tlingit-Haida by Median Family Income
In terms of median family income, the demographic groups most similar to Tlingit-Haida are Guamanian/Chamorro ($101,061, a difference of 0.030%), Celtic ($101,139, a difference of 0.050%), Dutch ($101,192, a difference of 0.10%), Immigrants from Portugal ($100,984, a difference of 0.11%), and Immigrants ($100,962, a difference of 0.13%).
| Demographics | Rating | Rank | Median Family Income |
| French Canadians | 37.0 /100 | #180 | Fair $101,634 |
| Spaniards | 36.8 /100 | #181 | Fair $101,617 |
| Tsimshian | 35.9 /100 | #182 | Fair $101,543 |
| Kenyans | 34.5 /100 | #183 | Fair $101,417 |
| Immigrants | Costa Rica | 33.7 /100 | #184 | Fair $101,354 |
| Dutch | 31.9 /100 | #185 | Fair $101,192 |
| Celtics | 31.3 /100 | #186 | Fair $101,139 |
| Tlingit-Haida | 30.8 /100 | #187 | Fair $101,092 |
| Guamanians/Chamorros | 30.5 /100 | #188 | Fair $101,061 |
| Immigrants | Portugal | 29.6 /100 | #189 | Fair $100,984 |
| Immigrants | Immigrants | 29.4 /100 | #190 | Fair $100,962 |
| Colombians | 27.2 /100 | #191 | Fair $100,750 |
| Immigrants | Kenya | 26.5 /100 | #192 | Fair $100,679 |
| Iraqis | 26.3 /100 | #193 | Fair $100,658 |
| Uruguayans | 26.3 /100 | #194 | Fair $100,656 |
Demographics Similar to Slovaks by Median Family Income
In terms of median family income, the demographic groups most similar to Slovaks are English ($103,684, a difference of 0.040%), South American Indian ($103,624, a difference of 0.10%), Sierra Leonean ($103,859, a difference of 0.13%), Immigrants from Peru ($103,534, a difference of 0.19%), and Immigrants from Sierra Leone ($103,990, a difference of 0.25%).
| Demographics | Rating | Rank | Median Family Income |
| Scandinavians | 70.8 /100 | #158 | Good $104,410 |
| Swiss | 70.7 /100 | #159 | Good $104,396 |
| Scottish | 69.5 /100 | #160 | Good $104,288 |
| Icelanders | 69.4 /100 | #161 | Good $104,282 |
| Immigrants | Sierra Leone | 66.2 /100 | #162 | Good $103,990 |
| Costa Ricans | 66.2 /100 | #163 | Good $103,989 |
| Sierra Leoneans | 64.7 /100 | #164 | Good $103,859 |
| Slovaks | 63.1 /100 | #165 | Good $103,729 |
| English | 62.6 /100 | #166 | Good $103,684 |
| South American Indians | 61.9 /100 | #167 | Good $103,624 |
| Immigrants | Peru | 60.8 /100 | #168 | Good $103,534 |
| Czechoslovakians | 57.6 /100 | #169 | Average $103,273 |
| Immigrants | Uzbekistan | 56.6 /100 | #170 | Average $103,197 |
| Alsatians | 54.3 /100 | #171 | Average $103,010 |
| Immigrants | Eritrea | 51.9 /100 | #172 | Average $102,823 |