Tlingit-Haida vs Immigrants from Zimbabwe Median Family Income
COMPARE
Tlingit-Haida
Immigrants from Zimbabwe
Median Family Income
Median Family Income Comparison
Tlingit-Haida
Immigrants from Zimbabwe
$101,092
MEDIAN FAMILY INCOME
30.8/ 100
METRIC RATING
187th/ 347
METRIC RANK
$108,830
MEDIAN FAMILY INCOME
95.9/ 100
METRIC RATING
108th/ 347
METRIC RANK
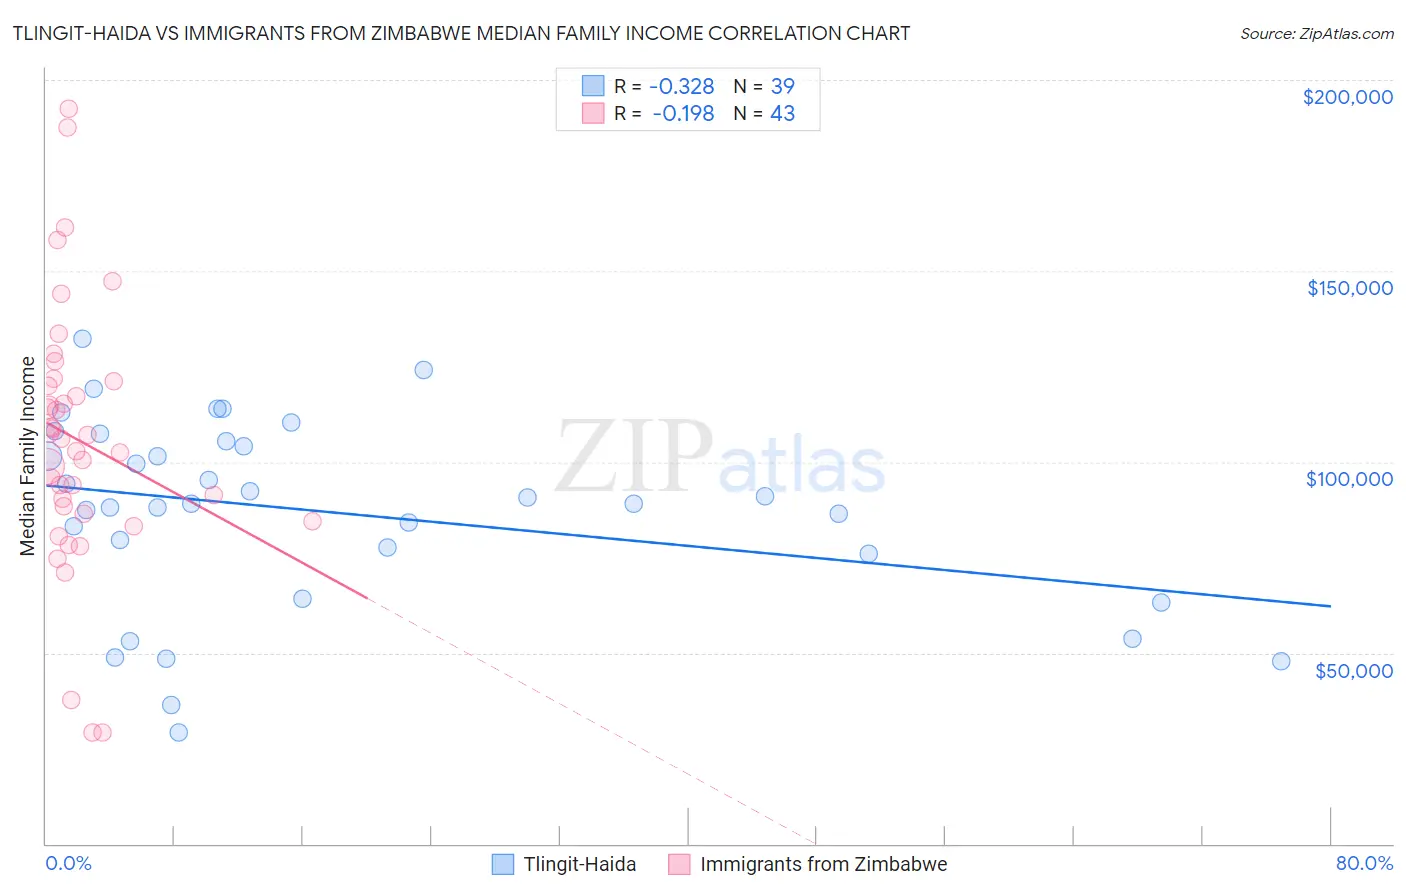
Tlingit-Haida vs Immigrants from Zimbabwe Median Family Income Correlation Chart
The statistical analysis conducted on geographies consisting of 60,853,273 people shows a mild negative correlation between the proportion of Tlingit-Haida and median family income in the United States with a correlation coefficient (R) of -0.328 and weighted average of $101,092. Similarly, the statistical analysis conducted on geographies consisting of 117,781,123 people shows a poor negative correlation between the proportion of Immigrants from Zimbabwe and median family income in the United States with a correlation coefficient (R) of -0.198 and weighted average of $108,830, a difference of 7.7%.
Median Family Income Correlation Summary
| Measurement | Tlingit-Haida | Immigrants from Zimbabwe |
| Minimum | $29,250 | $29,063 |
| Maximum | $132,184 | $192,404 |
| Range | $102,934 | $163,341 |
| Mean | $86,951 | $105,675 |
| Median | $88,958 | $105,969 |
| Interquartile 25% (IQ1) | $75,972 | $86,427 |
| Interquartile 75% (IQ3) | $105,493 | $121,096 |
| Interquartile Range (IQR) | $29,521 | $34,669 |
| Standard Deviation (Sample) | $24,804 | $34,287 |
| Standard Deviation (Population) | $24,484 | $33,886 |
Similar Demographics by Median Family Income
Demographics Similar to Tlingit-Haida by Median Family Income
In terms of median family income, the demographic groups most similar to Tlingit-Haida are Guamanian/Chamorro ($101,061, a difference of 0.030%), Celtic ($101,139, a difference of 0.050%), Dutch ($101,192, a difference of 0.10%), Immigrants from Portugal ($100,984, a difference of 0.11%), and Immigrants ($100,962, a difference of 0.13%).
| Demographics | Rating | Rank | Median Family Income |
| French Canadians | 37.0 /100 | #180 | Fair $101,634 |
| Spaniards | 36.8 /100 | #181 | Fair $101,617 |
| Tsimshian | 35.9 /100 | #182 | Fair $101,543 |
| Kenyans | 34.5 /100 | #183 | Fair $101,417 |
| Immigrants | Costa Rica | 33.7 /100 | #184 | Fair $101,354 |
| Dutch | 31.9 /100 | #185 | Fair $101,192 |
| Celtics | 31.3 /100 | #186 | Fair $101,139 |
| Tlingit-Haida | 30.8 /100 | #187 | Fair $101,092 |
| Guamanians/Chamorros | 30.5 /100 | #188 | Fair $101,061 |
| Immigrants | Portugal | 29.6 /100 | #189 | Fair $100,984 |
| Immigrants | Immigrants | 29.4 /100 | #190 | Fair $100,962 |
| Colombians | 27.2 /100 | #191 | Fair $100,750 |
| Immigrants | Kenya | 26.5 /100 | #192 | Fair $100,679 |
| Iraqis | 26.3 /100 | #193 | Fair $100,658 |
| Uruguayans | 26.3 /100 | #194 | Fair $100,656 |
Demographics Similar to Immigrants from Zimbabwe by Median Family Income
In terms of median family income, the demographic groups most similar to Immigrants from Zimbabwe are Immigrants from Afghanistan ($108,709, a difference of 0.11%), British ($108,705, a difference of 0.12%), Immigrants from Western Asia ($108,691, a difference of 0.13%), Immigrants from Poland ($108,570, a difference of 0.24%), and Immigrants from Saudi Arabia ($108,544, a difference of 0.26%).
| Demographics | Rating | Rank | Median Family Income |
| Immigrants | Ukraine | 97.2 /100 | #101 | Exceptional $109,645 |
| Assyrians/Chaldeans/Syriacs | 97.2 /100 | #102 | Exceptional $109,622 |
| Immigrants | Brazil | 96.9 /100 | #103 | Exceptional $109,418 |
| Palestinians | 96.9 /100 | #104 | Exceptional $109,413 |
| Syrians | 96.7 /100 | #105 | Exceptional $109,299 |
| Albanians | 96.4 /100 | #106 | Exceptional $109,136 |
| Immigrants | North Macedonia | 96.4 /100 | #107 | Exceptional $109,136 |
| Immigrants | Zimbabwe | 95.9 /100 | #108 | Exceptional $108,830 |
| Immigrants | Afghanistan | 95.6 /100 | #109 | Exceptional $108,709 |
| British | 95.6 /100 | #110 | Exceptional $108,705 |
| Immigrants | Western Asia | 95.6 /100 | #111 | Exceptional $108,691 |
| Immigrants | Poland | 95.3 /100 | #112 | Exceptional $108,570 |
| Immigrants | Saudi Arabia | 95.2 /100 | #113 | Exceptional $108,544 |
| Poles | 95.2 /100 | #114 | Exceptional $108,507 |
| Swedes | 95.1 /100 | #115 | Exceptional $108,499 |