Swedish vs Osage Wage/Income Gap
COMPARE
Swedish
Osage
Wage/Income Gap
Wage/Income Gap Comparison
Swedes
Osage
29.4%
WAGE/INCOME GAP
0.0/ 100
METRIC RATING
334th/ 347
METRIC RANK
27.1%
WAGE/INCOME GAP
4.4/ 100
METRIC RATING
238th/ 347
METRIC RANK
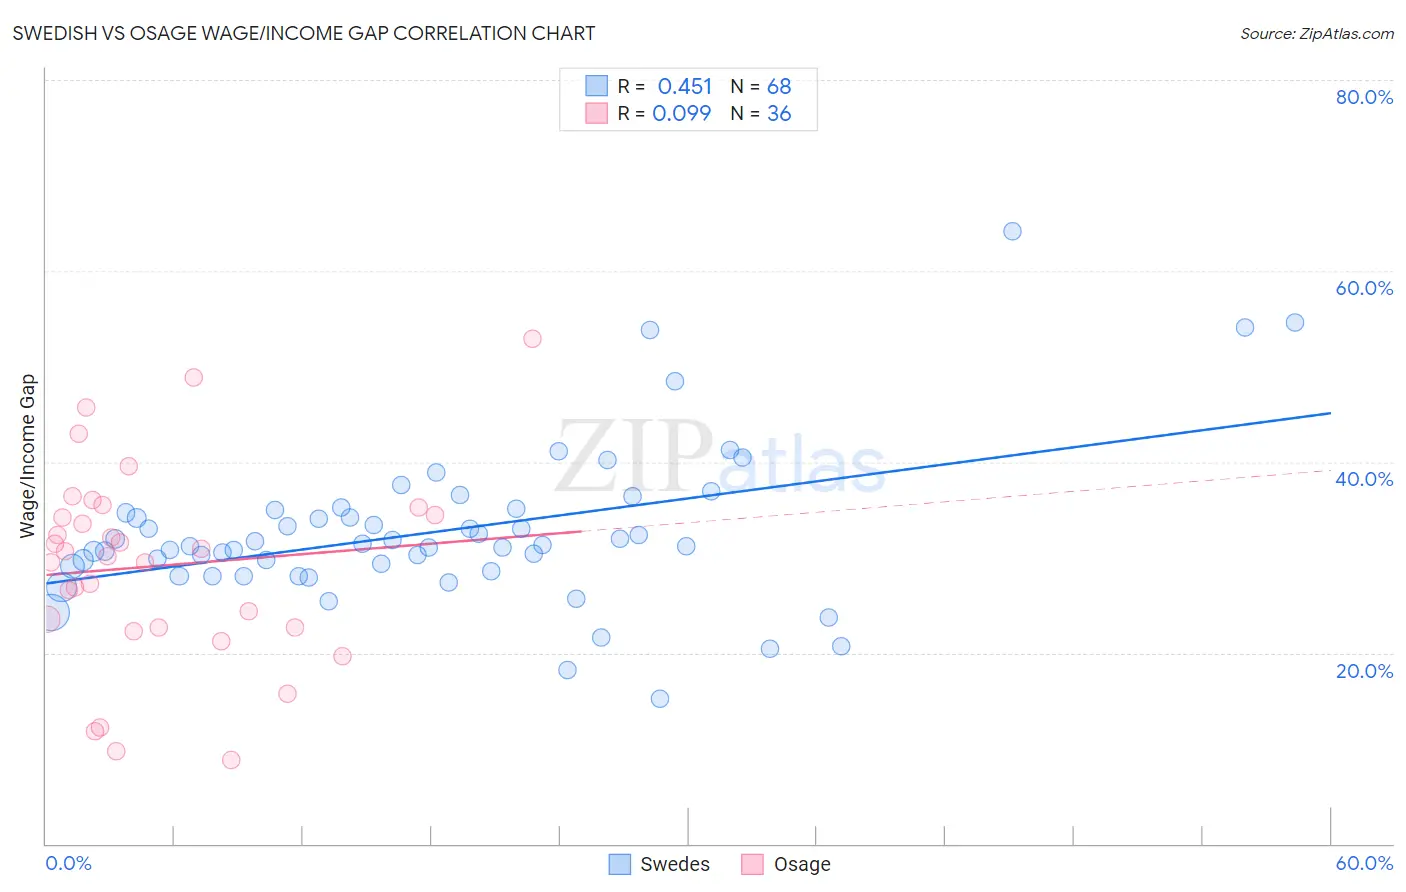
Swedish vs Osage Wage/Income Gap Correlation Chart
The statistical analysis conducted on geographies consisting of 537,447,925 people shows a moderate positive correlation between the proportion of Swedes and wage/income gap percentage in the United States with a correlation coefficient (R) of 0.451 and weighted average of 29.4%. Similarly, the statistical analysis conducted on geographies consisting of 91,772,804 people shows a slight positive correlation between the proportion of Osage and wage/income gap percentage in the United States with a correlation coefficient (R) of 0.099 and weighted average of 27.1%, a difference of 8.7%.
Wage/Income Gap Correlation Summary
| Measurement | Swedish | Osage |
| Minimum | 15.2% | 8.8% |
| Maximum | 64.2% | 52.9% |
| Range | 49.0% | 44.1% |
| Mean | 32.7% | 29.1% |
| Median | 31.2% | 30.4% |
| Interquartile 25% (IQ1) | 28.8% | 22.6% |
| Interquartile 75% (IQ3) | 34.8% | 34.9% |
| Interquartile Range (IQR) | 6.1% | 12.2% |
| Standard Deviation (Sample) | 8.2% | 10.3% |
| Standard Deviation (Population) | 8.1% | 10.2% |
Similar Demographics by Wage/Income Gap
Demographics Similar to Swedes by Wage/Income Gap
In terms of wage/income gap, the demographic groups most similar to Swedes are Immigrants from Taiwan (29.5%, a difference of 0.13%), European (29.4%, a difference of 0.14%), English (29.5%, a difference of 0.14%), Immigrants from South Central Asia (29.3%, a difference of 0.34%), and Dutch (29.6%, a difference of 0.72%).
| Demographics | Rating | Rank | Wage/Income Gap |
| Immigrants | Iran | 0.0 /100 | #327 | Tragic 29.1% |
| Scandinavians | 0.0 /100 | #328 | Tragic 29.1% |
| Scottish | 0.0 /100 | #329 | Tragic 29.1% |
| Germans | 0.0 /100 | #330 | Tragic 29.2% |
| Czechs | 0.0 /100 | #331 | Tragic 29.2% |
| Immigrants | South Central Asia | 0.0 /100 | #332 | Tragic 29.3% |
| Europeans | 0.0 /100 | #333 | Tragic 29.4% |
| Swedes | 0.0 /100 | #334 | Tragic 29.4% |
| Immigrants | Taiwan | 0.0 /100 | #335 | Tragic 29.5% |
| English | 0.0 /100 | #336 | Tragic 29.5% |
| Dutch | 0.0 /100 | #337 | Tragic 29.6% |
| Filipinos | 0.0 /100 | #338 | Tragic 29.7% |
| Iranians | 0.0 /100 | #339 | Tragic 29.7% |
| Swiss | 0.0 /100 | #340 | Tragic 30.0% |
| Thais | 0.0 /100 | #341 | Tragic 30.5% |
Demographics Similar to Osage by Wage/Income Gap
In terms of wage/income gap, the demographic groups most similar to Osage are Immigrants from Eastern Asia (27.1%, a difference of 0.0%), Estonian (27.1%, a difference of 0.020%), Immigrants from Romania (27.0%, a difference of 0.15%), Immigrants from Hungary (27.0%, a difference of 0.16%), and Immigrants from Pakistan (27.0%, a difference of 0.18%).
| Demographics | Rating | Rank | Wage/Income Gap |
| Bhutanese | 5.3 /100 | #231 | Tragic 27.0% |
| Argentineans | 5.2 /100 | #232 | Tragic 27.0% |
| Immigrants | Brazil | 5.0 /100 | #233 | Tragic 27.0% |
| Immigrants | Pakistan | 4.9 /100 | #234 | Tragic 27.0% |
| Immigrants | Hungary | 4.8 /100 | #235 | Tragic 27.0% |
| Immigrants | Romania | 4.8 /100 | #236 | Tragic 27.0% |
| Immigrants | Eastern Asia | 4.4 /100 | #237 | Tragic 27.1% |
| Osage | 4.4 /100 | #238 | Tragic 27.1% |
| Estonians | 4.3 /100 | #239 | Tragic 27.1% |
| Immigrants | Europe | 3.8 /100 | #240 | Tragic 27.1% |
| Creek | 3.8 /100 | #241 | Tragic 27.1% |
| Immigrants | Sri Lanka | 3.7 /100 | #242 | Tragic 27.1% |
| Spanish | 3.6 /100 | #243 | Tragic 27.1% |
| Chickasaw | 3.5 /100 | #244 | Tragic 27.2% |
| Immigrants | Azores | 3.5 /100 | #245 | Tragic 27.2% |