Subsaharan African vs Immigrants from Zimbabwe Per Capita Income
COMPARE
Subsaharan African
Immigrants from Zimbabwe
Per Capita Income
Per Capita Income Comparison
Sub-Saharan Africans
Immigrants from Zimbabwe
$40,152
PER CAPITA INCOME
1.9/ 100
METRIC RATING
245th/ 347
METRIC RANK
$47,394
PER CAPITA INCOME
98.5/ 100
METRIC RATING
93rd/ 347
METRIC RANK
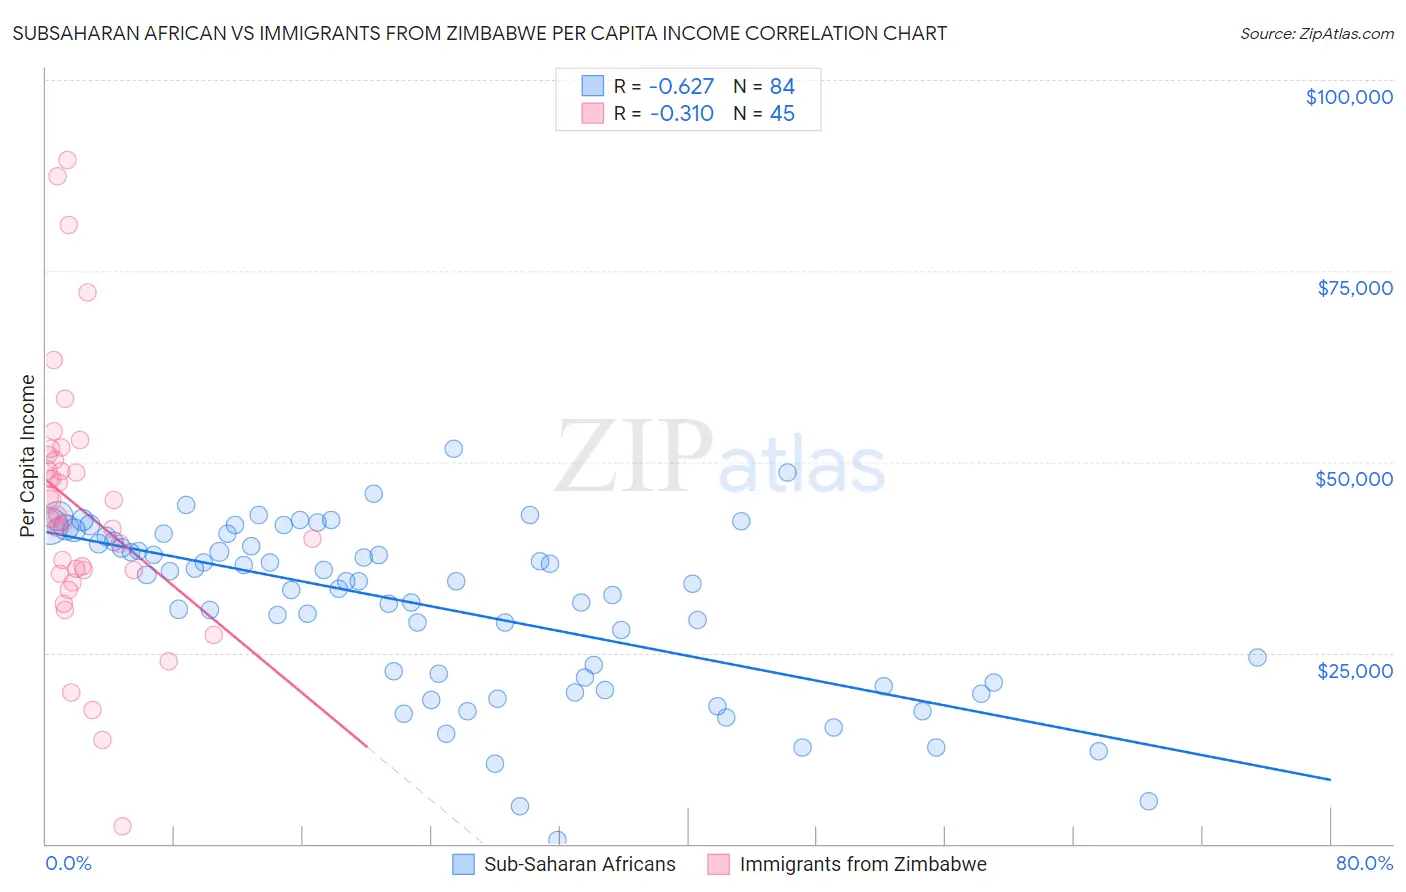
Subsaharan African vs Immigrants from Zimbabwe Per Capita Income Correlation Chart
The statistical analysis conducted on geographies consisting of 508,279,002 people shows a significant negative correlation between the proportion of Sub-Saharan Africans and per capita income in the United States with a correlation coefficient (R) of -0.627 and weighted average of $40,152. Similarly, the statistical analysis conducted on geographies consisting of 117,813,757 people shows a mild negative correlation between the proportion of Immigrants from Zimbabwe and per capita income in the United States with a correlation coefficient (R) of -0.310 and weighted average of $47,394, a difference of 18.0%.
Per Capita Income Correlation Summary
| Measurement | Subsaharan African | Immigrants from Zimbabwe |
| Minimum | $461 | $2,302 |
| Maximum | $51,790 | $89,578 |
| Range | $51,329 | $87,276 |
| Mean | $31,049 | $43,763 |
| Median | $34,354 | $42,560 |
| Interquartile 25% (IQ1) | $21,454 | $35,574 |
| Interquartile 75% (IQ3) | $39,919 | $50,554 |
| Interquartile Range (IQR) | $18,464 | $14,981 |
| Standard Deviation (Sample) | $11,215 | $17,068 |
| Standard Deviation (Population) | $11,148 | $16,878 |
Similar Demographics by Per Capita Income
Demographics Similar to Sub-Saharan Africans by Per Capita Income
In terms of per capita income, the demographic groups most similar to Sub-Saharan Africans are French American Indian ($40,244, a difference of 0.23%), Cree ($40,056, a difference of 0.24%), German Russian ($40,266, a difference of 0.28%), Immigrants from Western Africa ($40,294, a difference of 0.35%), and British West Indian ($40,330, a difference of 0.44%).
| Demographics | Rating | Rank | Per Capita Income |
| Somalis | 2.4 /100 | #238 | Tragic $40,367 |
| Tsimshian | 2.4 /100 | #239 | Tragic $40,344 |
| Immigrants | Nigeria | 2.3 /100 | #240 | Tragic $40,339 |
| British West Indians | 2.3 /100 | #241 | Tragic $40,330 |
| Immigrants | Western Africa | 2.2 /100 | #242 | Tragic $40,294 |
| German Russians | 2.2 /100 | #243 | Tragic $40,266 |
| French American Indians | 2.1 /100 | #244 | Tragic $40,244 |
| Sub-Saharan Africans | 1.9 /100 | #245 | Tragic $40,152 |
| Cree | 1.7 /100 | #246 | Tragic $40,056 |
| Immigrants | Somalia | 1.6 /100 | #247 | Tragic $39,974 |
| Cape Verdeans | 1.5 /100 | #248 | Tragic $39,935 |
| Japanese | 1.4 /100 | #249 | Tragic $39,870 |
| Immigrants | Burma/Myanmar | 1.3 /100 | #250 | Tragic $39,827 |
| Samoans | 1.3 /100 | #251 | Tragic $39,826 |
| Immigrants | Azores | 1.0 /100 | #252 | Tragic $39,608 |
Demographics Similar to Immigrants from Zimbabwe by Per Capita Income
In terms of per capita income, the demographic groups most similar to Immigrants from Zimbabwe are Albanian ($47,379, a difference of 0.030%), Immigrants from Egypt ($47,361, a difference of 0.070%), Immigrants from Moldova ($47,489, a difference of 0.20%), Alsatian ($47,284, a difference of 0.23%), and Carpatho Rusyn ($47,248, a difference of 0.31%).
| Demographics | Rating | Rank | Per Capita Income |
| Immigrants | Southern Europe | 99.3 /100 | #86 | Exceptional $48,027 |
| Ukrainians | 99.3 /100 | #87 | Exceptional $48,014 |
| Croatians | 99.0 /100 | #88 | Exceptional $47,742 |
| Northern Europeans | 98.9 /100 | #89 | Exceptional $47,698 |
| Italians | 98.8 /100 | #90 | Exceptional $47,574 |
| Macedonians | 98.8 /100 | #91 | Exceptional $47,573 |
| Immigrants | Moldova | 98.7 /100 | #92 | Exceptional $47,489 |
| Immigrants | Zimbabwe | 98.5 /100 | #93 | Exceptional $47,394 |
| Albanians | 98.5 /100 | #94 | Exceptional $47,379 |
| Immigrants | Egypt | 98.5 /100 | #95 | Exceptional $47,361 |
| Alsatians | 98.3 /100 | #96 | Exceptional $47,284 |
| Carpatho Rusyns | 98.2 /100 | #97 | Exceptional $47,248 |
| Immigrants | Pakistan | 97.9 /100 | #98 | Exceptional $47,084 |
| Laotians | 97.8 /100 | #99 | Exceptional $47,041 |
| Immigrants | Lebanon | 97.5 /100 | #100 | Exceptional $46,938 |