Subsaharan African vs West Indian Per Capita Income
COMPARE
Subsaharan African
West Indian
Per Capita Income
Per Capita Income Comparison
Sub-Saharan Africans
West Indians
$40,152
PER CAPITA INCOME
1.9/ 100
METRIC RATING
245th/ 347
METRIC RANK
$41,217
PER CAPITA INCOME
6.0/ 100
METRIC RATING
225th/ 347
METRIC RANK
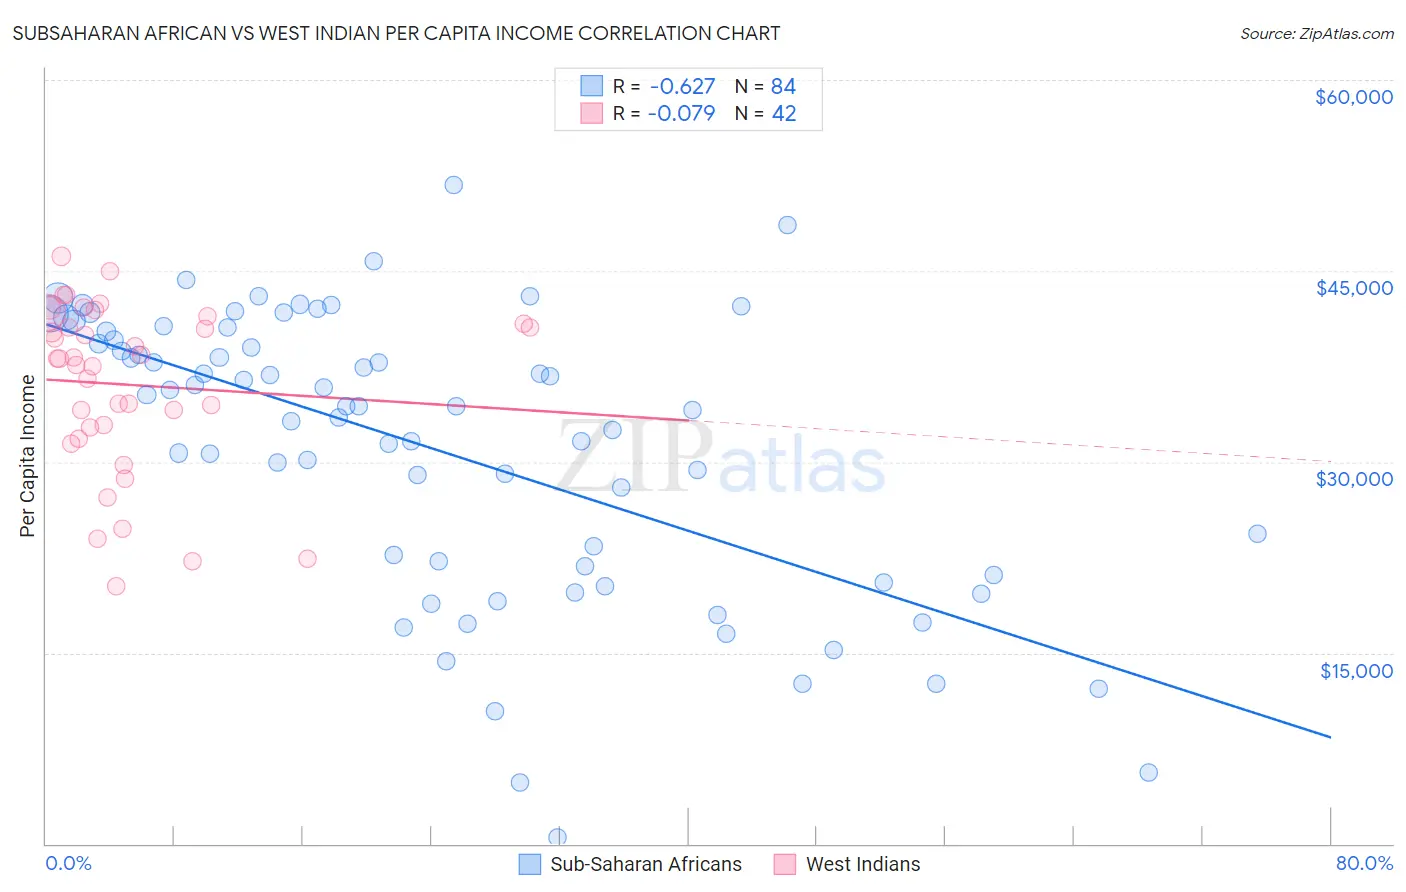
Subsaharan African vs West Indian Per Capita Income Correlation Chart
The statistical analysis conducted on geographies consisting of 508,279,002 people shows a significant negative correlation between the proportion of Sub-Saharan Africans and per capita income in the United States with a correlation coefficient (R) of -0.627 and weighted average of $40,152. Similarly, the statistical analysis conducted on geographies consisting of 254,069,364 people shows a slight negative correlation between the proportion of West Indians and per capita income in the United States with a correlation coefficient (R) of -0.079 and weighted average of $41,217, a difference of 2.6%.
Per Capita Income Correlation Summary
| Measurement | Subsaharan African | West Indian |
| Minimum | $461 | $20,227 |
| Maximum | $51,790 | $46,150 |
| Range | $51,329 | $25,923 |
| Mean | $31,049 | $36,063 |
| Median | $34,354 | $38,086 |
| Interquartile 25% (IQ1) | $21,454 | $32,716 |
| Interquartile 75% (IQ3) | $39,919 | $40,860 |
| Interquartile Range (IQR) | $18,464 | $8,144 |
| Standard Deviation (Sample) | $11,215 | $6,624 |
| Standard Deviation (Population) | $11,148 | $6,544 |
Demographics Similar to Sub-Saharan Africans and West Indians by Per Capita Income
In terms of per capita income, the demographic groups most similar to Sub-Saharan Africans are French American Indian ($40,244, a difference of 0.23%), German Russian ($40,266, a difference of 0.28%), Immigrants from Western Africa ($40,294, a difference of 0.35%), British West Indian ($40,330, a difference of 0.44%), and Immigrants from Nigeria ($40,339, a difference of 0.46%). Similarly, the demographic groups most similar to West Indians are Immigrants from Ecuador ($41,195, a difference of 0.050%), Immigrants from Ghana ($41,131, a difference of 0.21%), Immigrants from Grenada ($41,123, a difference of 0.23%), Nigerian ($41,026, a difference of 0.47%), and Native Hawaiian ($41,017, a difference of 0.49%).
| Demographics | Rating | Rank | Per Capita Income |
| West Indians | 6.0 /100 | #225 | Tragic $41,217 |
| Immigrants | Ecuador | 5.9 /100 | #226 | Tragic $41,195 |
| Immigrants | Ghana | 5.5 /100 | #227 | Tragic $41,131 |
| Immigrants | Grenada | 5.5 /100 | #228 | Tragic $41,123 |
| Nigerians | 4.9 /100 | #229 | Tragic $41,026 |
| Native Hawaiians | 4.9 /100 | #230 | Tragic $41,017 |
| Senegalese | 4.8 /100 | #231 | Tragic $41,000 |
| Guyanese | 4.5 /100 | #232 | Tragic $40,949 |
| Delaware | 3.8 /100 | #233 | Tragic $40,778 |
| Immigrants | West Indies | 3.7 /100 | #234 | Tragic $40,763 |
| Immigrants | Guyana | 3.6 /100 | #235 | Tragic $40,742 |
| Immigrants | Nonimmigrants | 3.4 /100 | #236 | Tragic $40,669 |
| Immigrants | Cambodia | 2.6 /100 | #237 | Tragic $40,434 |
| Somalis | 2.4 /100 | #238 | Tragic $40,367 |
| Tsimshian | 2.4 /100 | #239 | Tragic $40,344 |
| Immigrants | Nigeria | 2.3 /100 | #240 | Tragic $40,339 |
| British West Indians | 2.3 /100 | #241 | Tragic $40,330 |
| Immigrants | Western Africa | 2.2 /100 | #242 | Tragic $40,294 |
| German Russians | 2.2 /100 | #243 | Tragic $40,266 |
| French American Indians | 2.1 /100 | #244 | Tragic $40,244 |
| Sub-Saharan Africans | 1.9 /100 | #245 | Tragic $40,152 |