Subsaharan African vs Immigrants from Romania Per Capita Income
COMPARE
Subsaharan African
Immigrants from Romania
Per Capita Income
Per Capita Income Comparison
Sub-Saharan Africans
Immigrants from Romania
$40,152
PER CAPITA INCOME
1.9/ 100
METRIC RATING
245th/ 347
METRIC RANK
$49,463
PER CAPITA INCOME
99.9/ 100
METRIC RATING
67th/ 347
METRIC RANK
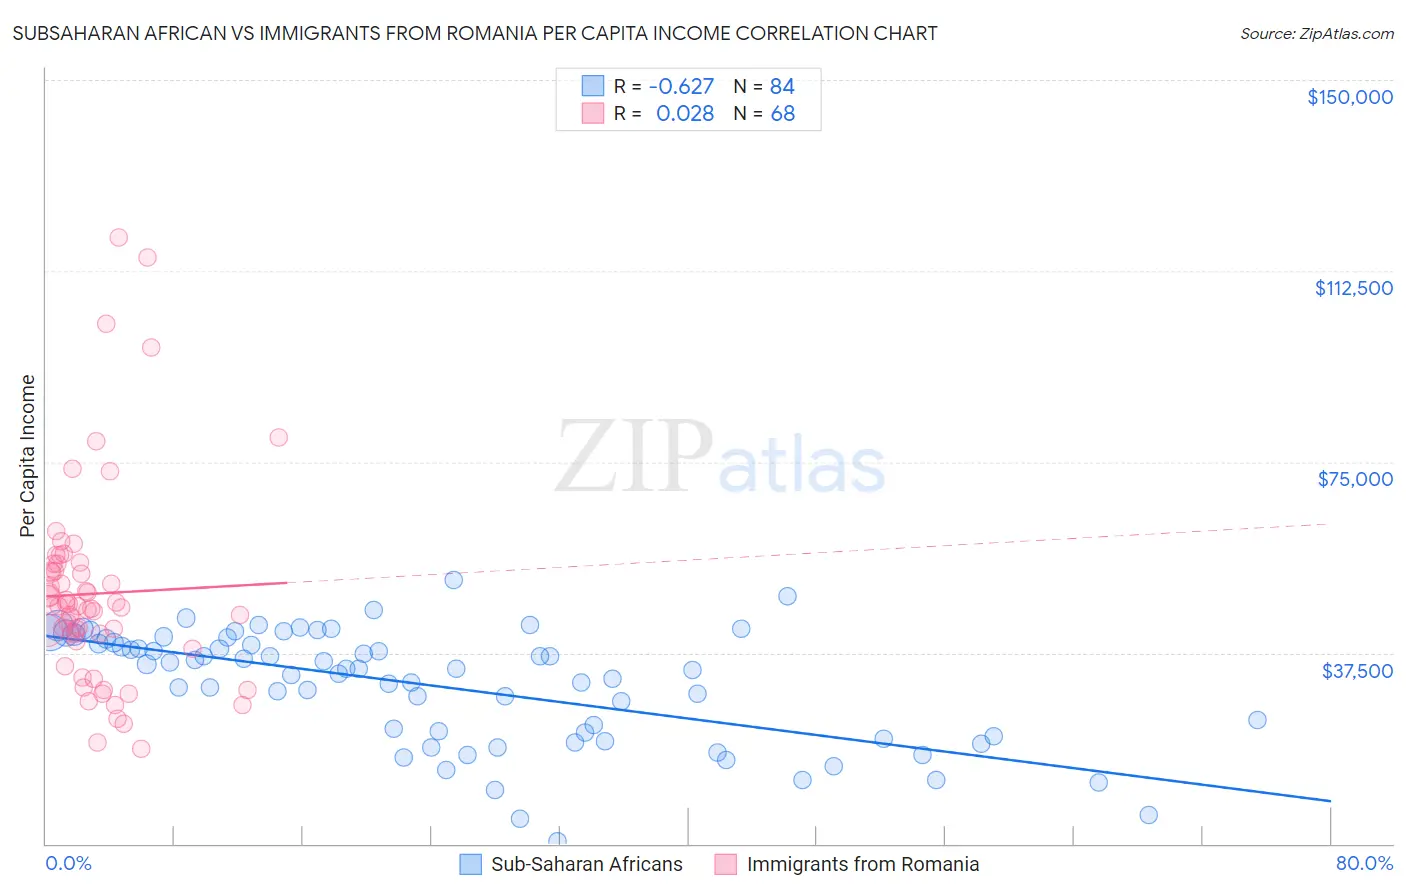
Subsaharan African vs Immigrants from Romania Per Capita Income Correlation Chart
The statistical analysis conducted on geographies consisting of 508,279,002 people shows a significant negative correlation between the proportion of Sub-Saharan Africans and per capita income in the United States with a correlation coefficient (R) of -0.627 and weighted average of $40,152. Similarly, the statistical analysis conducted on geographies consisting of 256,972,544 people shows no correlation between the proportion of Immigrants from Romania and per capita income in the United States with a correlation coefficient (R) of 0.028 and weighted average of $49,463, a difference of 23.2%.
Per Capita Income Correlation Summary
| Measurement | Subsaharan African | Immigrants from Romania |
| Minimum | $461 | $18,731 |
| Maximum | $51,790 | $119,092 |
| Range | $51,329 | $100,361 |
| Mean | $31,049 | $49,122 |
| Median | $34,354 | $46,712 |
| Interquartile 25% (IQ1) | $21,454 | $40,435 |
| Interquartile 75% (IQ3) | $39,919 | $54,228 |
| Interquartile Range (IQR) | $18,464 | $13,794 |
| Standard Deviation (Sample) | $11,215 | $19,681 |
| Standard Deviation (Population) | $11,148 | $19,535 |
Similar Demographics by Per Capita Income
Demographics Similar to Sub-Saharan Africans by Per Capita Income
In terms of per capita income, the demographic groups most similar to Sub-Saharan Africans are French American Indian ($40,244, a difference of 0.23%), Cree ($40,056, a difference of 0.24%), German Russian ($40,266, a difference of 0.28%), Immigrants from Western Africa ($40,294, a difference of 0.35%), and British West Indian ($40,330, a difference of 0.44%).
| Demographics | Rating | Rank | Per Capita Income |
| Somalis | 2.4 /100 | #238 | Tragic $40,367 |
| Tsimshian | 2.4 /100 | #239 | Tragic $40,344 |
| Immigrants | Nigeria | 2.3 /100 | #240 | Tragic $40,339 |
| British West Indians | 2.3 /100 | #241 | Tragic $40,330 |
| Immigrants | Western Africa | 2.2 /100 | #242 | Tragic $40,294 |
| German Russians | 2.2 /100 | #243 | Tragic $40,266 |
| French American Indians | 2.1 /100 | #244 | Tragic $40,244 |
| Sub-Saharan Africans | 1.9 /100 | #245 | Tragic $40,152 |
| Cree | 1.7 /100 | #246 | Tragic $40,056 |
| Immigrants | Somalia | 1.6 /100 | #247 | Tragic $39,974 |
| Cape Verdeans | 1.5 /100 | #248 | Tragic $39,935 |
| Japanese | 1.4 /100 | #249 | Tragic $39,870 |
| Immigrants | Burma/Myanmar | 1.3 /100 | #250 | Tragic $39,827 |
| Samoans | 1.3 /100 | #251 | Tragic $39,826 |
| Immigrants | Azores | 1.0 /100 | #252 | Tragic $39,608 |
Demographics Similar to Immigrants from Romania by Per Capita Income
In terms of per capita income, the demographic groups most similar to Immigrants from Romania are Lithuanian ($49,448, a difference of 0.030%), Immigrants from Bulgaria ($49,482, a difference of 0.040%), Immigrants from Canada ($49,412, a difference of 0.10%), Bolivian ($49,526, a difference of 0.13%), and Immigrants from Eastern Europe ($49,316, a difference of 0.30%).
| Demographics | Rating | Rank | Per Capita Income |
| Immigrants | Scotland | 99.9 /100 | #60 | Exceptional $49,893 |
| Argentineans | 99.9 /100 | #61 | Exceptional $49,862 |
| Immigrants | Asia | 99.9 /100 | #62 | Exceptional $49,741 |
| Maltese | 99.9 /100 | #63 | Exceptional $49,640 |
| Immigrants | Argentina | 99.9 /100 | #64 | Exceptional $49,627 |
| Bolivians | 99.9 /100 | #65 | Exceptional $49,526 |
| Immigrants | Bulgaria | 99.9 /100 | #66 | Exceptional $49,482 |
| Immigrants | Romania | 99.9 /100 | #67 | Exceptional $49,463 |
| Lithuanians | 99.8 /100 | #68 | Exceptional $49,448 |
| Immigrants | Canada | 99.8 /100 | #69 | Exceptional $49,412 |
| Immigrants | Eastern Europe | 99.8 /100 | #70 | Exceptional $49,316 |
| Greeks | 99.8 /100 | #71 | Exceptional $49,309 |
| Immigrants | Hungary | 99.8 /100 | #72 | Exceptional $49,303 |
| Immigrants | North America | 99.8 /100 | #73 | Exceptional $49,302 |
| Mongolians | 99.8 /100 | #74 | Exceptional $49,173 |