Subsaharan African vs Immigrants from Zimbabwe Unemployment Among Women with Children Under 6 years
COMPARE
Subsaharan African
Immigrants from Zimbabwe
Unemployment Among Women with Children Under 6 years
Unemployment Among Women with Children Under 6 years Comparison
Sub-Saharan Africans
Immigrants from Zimbabwe
8.4%
UNEMPLOYMENT AMONG WOMEN WITH CHILDREN UNDER 6 YEARS
0.2/ 100
METRIC RATING
268th/ 347
METRIC RANK
7.1%
UNEMPLOYMENT AMONG WOMEN WITH CHILDREN UNDER 6 YEARS
98.6/ 100
METRIC RATING
86th/ 347
METRIC RANK
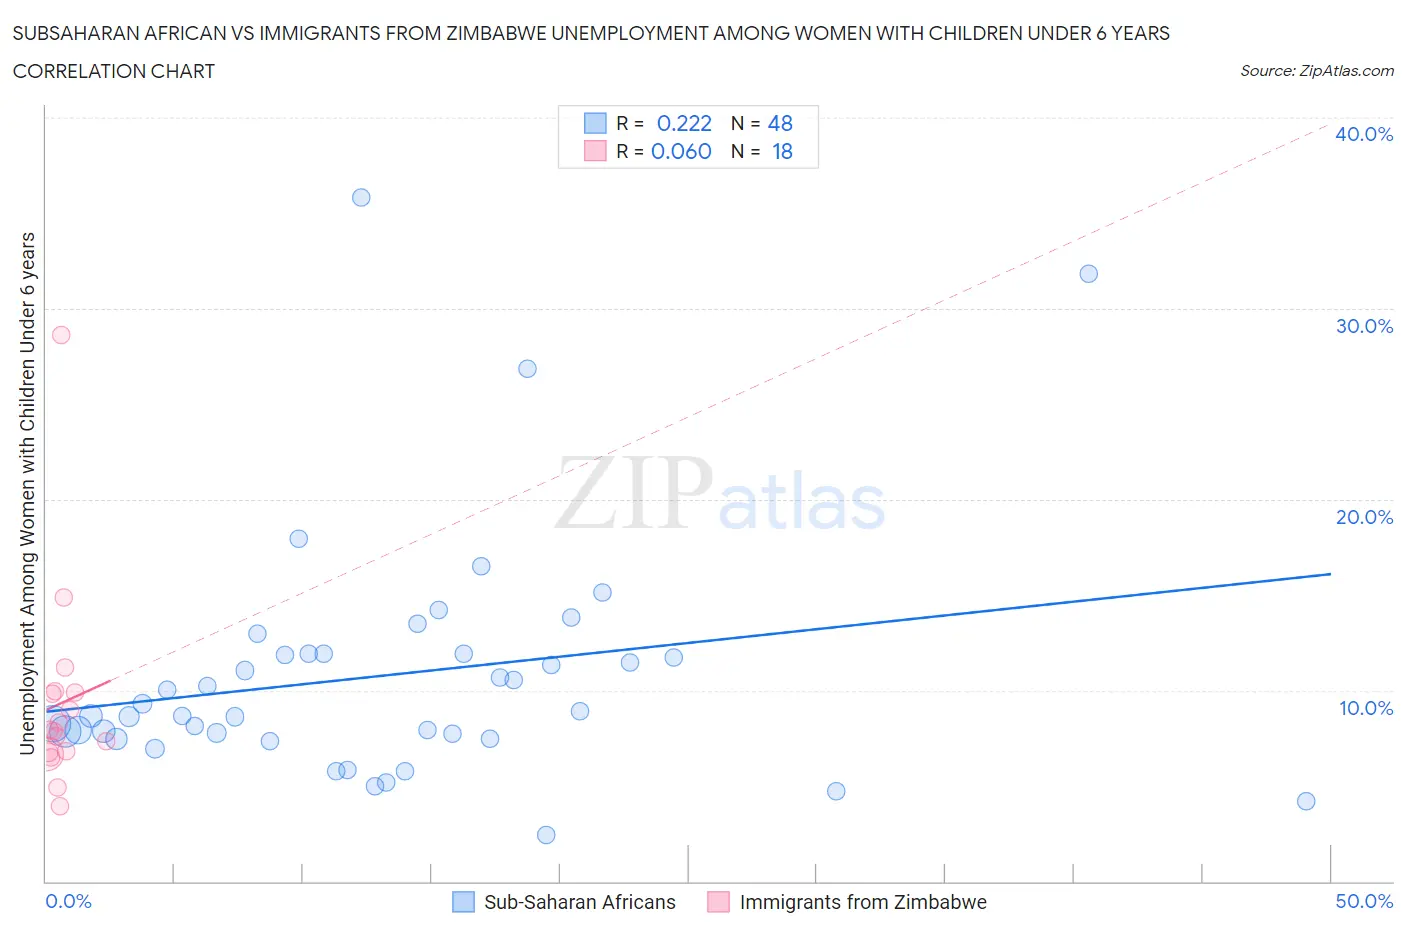
Subsaharan African vs Immigrants from Zimbabwe Unemployment Among Women with Children Under 6 years Correlation Chart
The statistical analysis conducted on geographies consisting of 364,369,549 people shows a weak positive correlation between the proportion of Sub-Saharan Africans and unemployment rate among women with children under the age of 6 in the United States with a correlation coefficient (R) of 0.222 and weighted average of 8.4%. Similarly, the statistical analysis conducted on geographies consisting of 104,806,788 people shows a slight positive correlation between the proportion of Immigrants from Zimbabwe and unemployment rate among women with children under the age of 6 in the United States with a correlation coefficient (R) of 0.060 and weighted average of 7.1%, a difference of 18.5%.
Unemployment Among Women with Children Under 6 years Correlation Summary
| Measurement | Subsaharan African | Immigrants from Zimbabwe |
| Minimum | 2.4% | 3.9% |
| Maximum | 35.8% | 28.6% |
| Range | 33.4% | 24.7% |
| Mean | 10.8% | 9.3% |
| Median | 8.8% | 7.9% |
| Interquartile 25% (IQ1) | 7.6% | 6.8% |
| Interquartile 75% (IQ3) | 11.9% | 9.9% |
| Interquartile Range (IQR) | 4.3% | 3.1% |
| Standard Deviation (Sample) | 6.4% | 5.4% |
| Standard Deviation (Population) | 6.3% | 5.2% |
Similar Demographics by Unemployment Among Women with Children Under 6 years
Demographics Similar to Sub-Saharan Africans by Unemployment Among Women with Children Under 6 years
In terms of unemployment among women with children under 6 years, the demographic groups most similar to Sub-Saharan Africans are Immigrants from Haiti (8.4%, a difference of 0.090%), Belizean (8.4%, a difference of 0.10%), French Canadian (8.4%, a difference of 0.37%), Immigrants from Honduras (8.4%, a difference of 0.37%), and Honduran (8.4%, a difference of 0.42%).
| Demographics | Rating | Rank | Unemployment Among Women with Children Under 6 years |
| Immigrants | Liberia | 0.3 /100 | #261 | Tragic 8.4% |
| West Indians | 0.3 /100 | #262 | Tragic 8.4% |
| Scotch-Irish | 0.3 /100 | #263 | Tragic 8.4% |
| Hondurans | 0.3 /100 | #264 | Tragic 8.4% |
| French Canadians | 0.3 /100 | #265 | Tragic 8.4% |
| Immigrants | Honduras | 0.3 /100 | #266 | Tragic 8.4% |
| Belizeans | 0.2 /100 | #267 | Tragic 8.4% |
| Sub-Saharan Africans | 0.2 /100 | #268 | Tragic 8.4% |
| Immigrants | Haiti | 0.2 /100 | #269 | Tragic 8.4% |
| Immigrants | Senegal | 0.2 /100 | #270 | Tragic 8.5% |
| Immigrants | Congo | 0.2 /100 | #271 | Tragic 8.5% |
| Mexican American Indians | 0.1 /100 | #272 | Tragic 8.5% |
| Slovaks | 0.1 /100 | #273 | Tragic 8.5% |
| Immigrants | Cameroon | 0.1 /100 | #274 | Tragic 8.6% |
| Immigrants | Latin America | 0.1 /100 | #275 | Tragic 8.6% |
Demographics Similar to Immigrants from Zimbabwe by Unemployment Among Women with Children Under 6 years
In terms of unemployment among women with children under 6 years, the demographic groups most similar to Immigrants from Zimbabwe are Immigrants from Romania (7.1%, a difference of 0.13%), Alsatian (7.1%, a difference of 0.15%), Immigrants from Albania (7.1%, a difference of 0.16%), Egyptian (7.1%, a difference of 0.21%), and Immigrants from Afghanistan (7.1%, a difference of 0.25%).
| Demographics | Rating | Rank | Unemployment Among Women with Children Under 6 years |
| Immigrants | Fiji | 98.9 /100 | #79 | Exceptional 7.1% |
| Immigrants | Greece | 98.9 /100 | #80 | Exceptional 7.1% |
| Immigrants | Venezuela | 98.8 /100 | #81 | Exceptional 7.1% |
| Immigrants | Afghanistan | 98.7 /100 | #82 | Exceptional 7.1% |
| Egyptians | 98.7 /100 | #83 | Exceptional 7.1% |
| Immigrants | Albania | 98.7 /100 | #84 | Exceptional 7.1% |
| Immigrants | Romania | 98.7 /100 | #85 | Exceptional 7.1% |
| Immigrants | Zimbabwe | 98.6 /100 | #86 | Exceptional 7.1% |
| Alsatians | 98.4 /100 | #87 | Exceptional 7.1% |
| Immigrants | Hungary | 98.3 /100 | #88 | Exceptional 7.1% |
| Immigrants | Denmark | 98.3 /100 | #89 | Exceptional 7.1% |
| Immigrants | Spain | 98.2 /100 | #90 | Exceptional 7.1% |
| Danes | 98.2 /100 | #91 | Exceptional 7.1% |
| Albanians | 98.0 /100 | #92 | Exceptional 7.2% |
| New Zealanders | 97.8 /100 | #93 | Exceptional 7.2% |