Spaniard vs Immigrants from Portugal Median Female Earnings
COMPARE
Spaniard
Immigrants from Portugal
Median Female Earnings
Median Female Earnings Comparison
Spaniards
Immigrants from Portugal
$38,656
MEDIAN FEMALE EARNINGS
10.3/ 100
METRIC RATING
215th/ 347
METRIC RANK
$39,788
MEDIAN FEMALE EARNINGS
54.7/ 100
METRIC RATING
171st/ 347
METRIC RANK
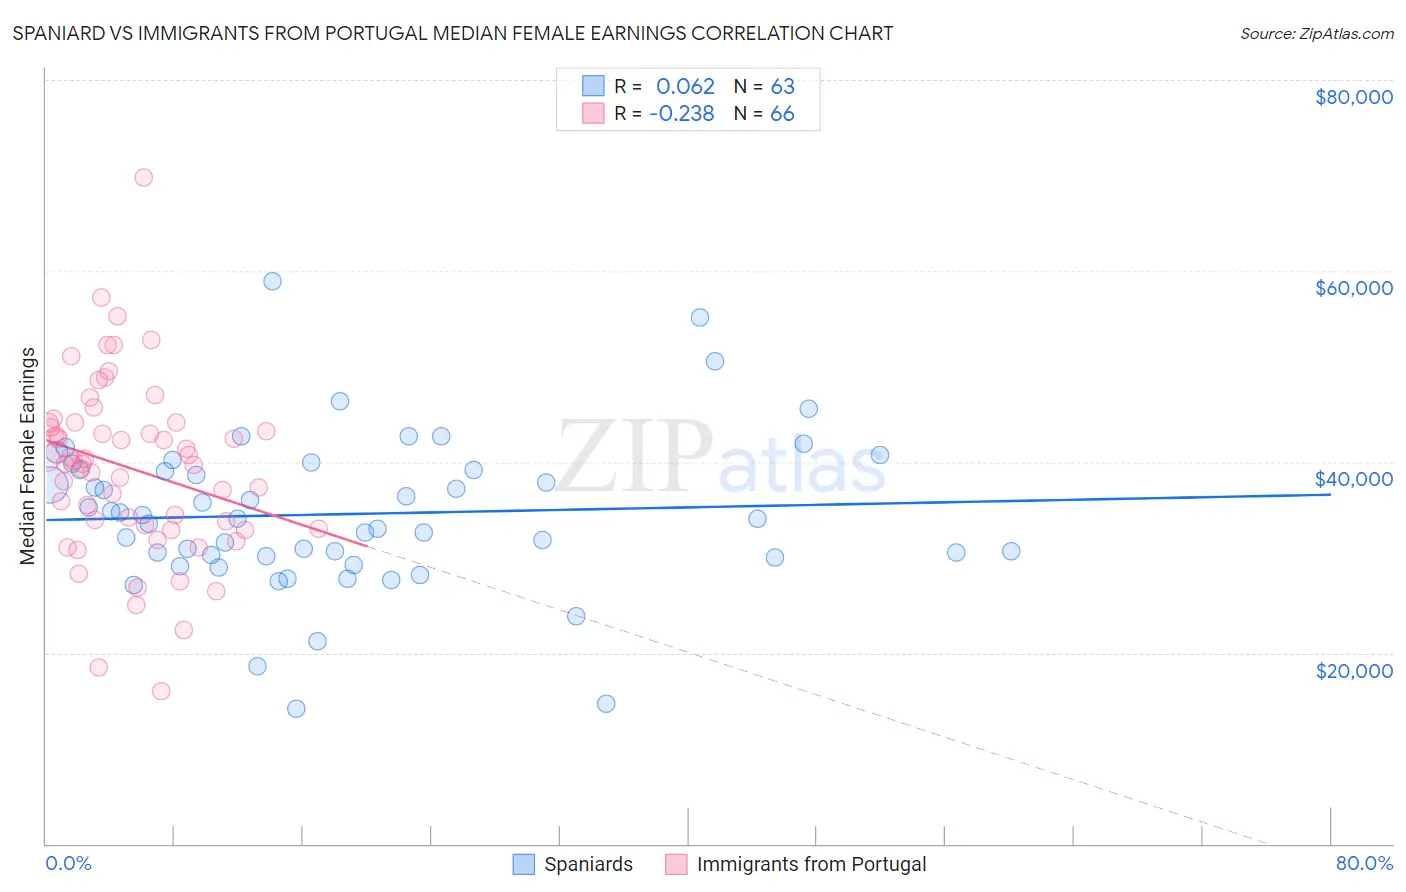
Spaniard vs Immigrants from Portugal Median Female Earnings Correlation Chart
The statistical analysis conducted on geographies consisting of 443,223,610 people shows a slight positive correlation between the proportion of Spaniards and median female earnings in the United States with a correlation coefficient (R) of 0.062 and weighted average of $38,656. Similarly, the statistical analysis conducted on geographies consisting of 174,753,972 people shows a weak negative correlation between the proportion of Immigrants from Portugal and median female earnings in the United States with a correlation coefficient (R) of -0.238 and weighted average of $39,788, a difference of 2.9%.
Median Female Earnings Correlation Summary
| Measurement | Spaniard | Immigrants from Portugal |
| Minimum | $14,192 | $15,996 |
| Maximum | $58,909 | $69,732 |
| Range | $44,717 | $53,736 |
| Mean | $34,527 | $39,346 |
| Median | $34,038 | $39,980 |
| Interquartile 25% (IQ1) | $30,169 | $33,451 |
| Interquartile 75% (IQ3) | $39,139 | $44,115 |
| Interquartile Range (IQR) | $8,970 | $10,664 |
| Standard Deviation (Sample) | $8,078 | $9,199 |
| Standard Deviation (Population) | $8,014 | $9,130 |
Similar Demographics by Median Female Earnings
Demographics Similar to Spaniards by Median Female Earnings
In terms of median female earnings, the demographic groups most similar to Spaniards are Iraqi ($38,666, a difference of 0.020%), Jamaican ($38,670, a difference of 0.030%), Immigrants from Ecuador ($38,644, a difference of 0.030%), Immigrants from Jamaica ($38,625, a difference of 0.080%), and Cape Verdean ($38,614, a difference of 0.11%).
| Demographics | Rating | Rank | Median Female Earnings |
| Immigrants | Thailand | 13.6 /100 | #208 | Poor $38,810 |
| Norwegians | 13.4 /100 | #209 | Poor $38,802 |
| Czechoslovakians | 12.0 /100 | #210 | Poor $38,738 |
| Aleuts | 11.6 /100 | #211 | Poor $38,719 |
| Guamanians/Chamorros | 11.5 /100 | #212 | Poor $38,717 |
| Jamaicans | 10.5 /100 | #213 | Poor $38,670 |
| Iraqis | 10.5 /100 | #214 | Poor $38,666 |
| Spaniards | 10.3 /100 | #215 | Poor $38,656 |
| Immigrants | Ecuador | 10.1 /100 | #216 | Poor $38,644 |
| Immigrants | Jamaica | 9.7 /100 | #217 | Tragic $38,625 |
| Cape Verdeans | 9.5 /100 | #218 | Tragic $38,614 |
| Nepalese | 9.3 /100 | #219 | Tragic $38,603 |
| Yugoslavians | 8.8 /100 | #220 | Tragic $38,573 |
| Immigrants | Azores | 8.8 /100 | #221 | Tragic $38,573 |
| Japanese | 8.1 /100 | #222 | Tragic $38,528 |
Demographics Similar to Immigrants from Portugal by Median Female Earnings
In terms of median female earnings, the demographic groups most similar to Immigrants from Portugal are British ($39,772, a difference of 0.040%), Slovene ($39,817, a difference of 0.070%), Canadian ($39,724, a difference of 0.16%), Kenyan ($39,860, a difference of 0.18%), and Immigrants from Peru ($39,871, a difference of 0.21%).
| Demographics | Rating | Rank | Median Female Earnings |
| Immigrants | Saudi Arabia | 62.9 /100 | #164 | Good $39,952 |
| Immigrants | Bangladesh | 60.8 /100 | #165 | Good $39,910 |
| Immigrants | Ghana | 60.0 /100 | #166 | Good $39,894 |
| Luxembourgers | 59.9 /100 | #167 | Average $39,891 |
| Immigrants | Peru | 58.9 /100 | #168 | Average $39,871 |
| Kenyans | 58.4 /100 | #169 | Average $39,860 |
| Slovenes | 56.2 /100 | #170 | Average $39,817 |
| Immigrants | Portugal | 54.7 /100 | #171 | Average $39,788 |
| British | 53.8 /100 | #172 | Average $39,772 |
| Canadians | 51.4 /100 | #173 | Average $39,724 |
| South Americans | 50.0 /100 | #174 | Average $39,698 |
| Immigrants | South America | 47.2 /100 | #175 | Average $39,643 |
| Nigerians | 47.0 /100 | #176 | Average $39,641 |
| Costa Ricans | 46.1 /100 | #177 | Average $39,622 |
| Slavs | 45.6 /100 | #178 | Average $39,613 |