White/Caucasian vs Immigrants from Eastern Africa Median Female Earnings
COMPARE
White/Caucasian
Immigrants from Eastern Africa
Median Female Earnings
Median Female Earnings Comparison
Whites/Caucasians
Immigrants from Eastern Africa
$37,531
MEDIAN FEMALE EARNINGS
1.1/ 100
METRIC RATING
254th/ 347
METRIC RANK
$40,644
MEDIAN FEMALE EARNINGS
87.7/ 100
METRIC RATING
136th/ 347
METRIC RANK
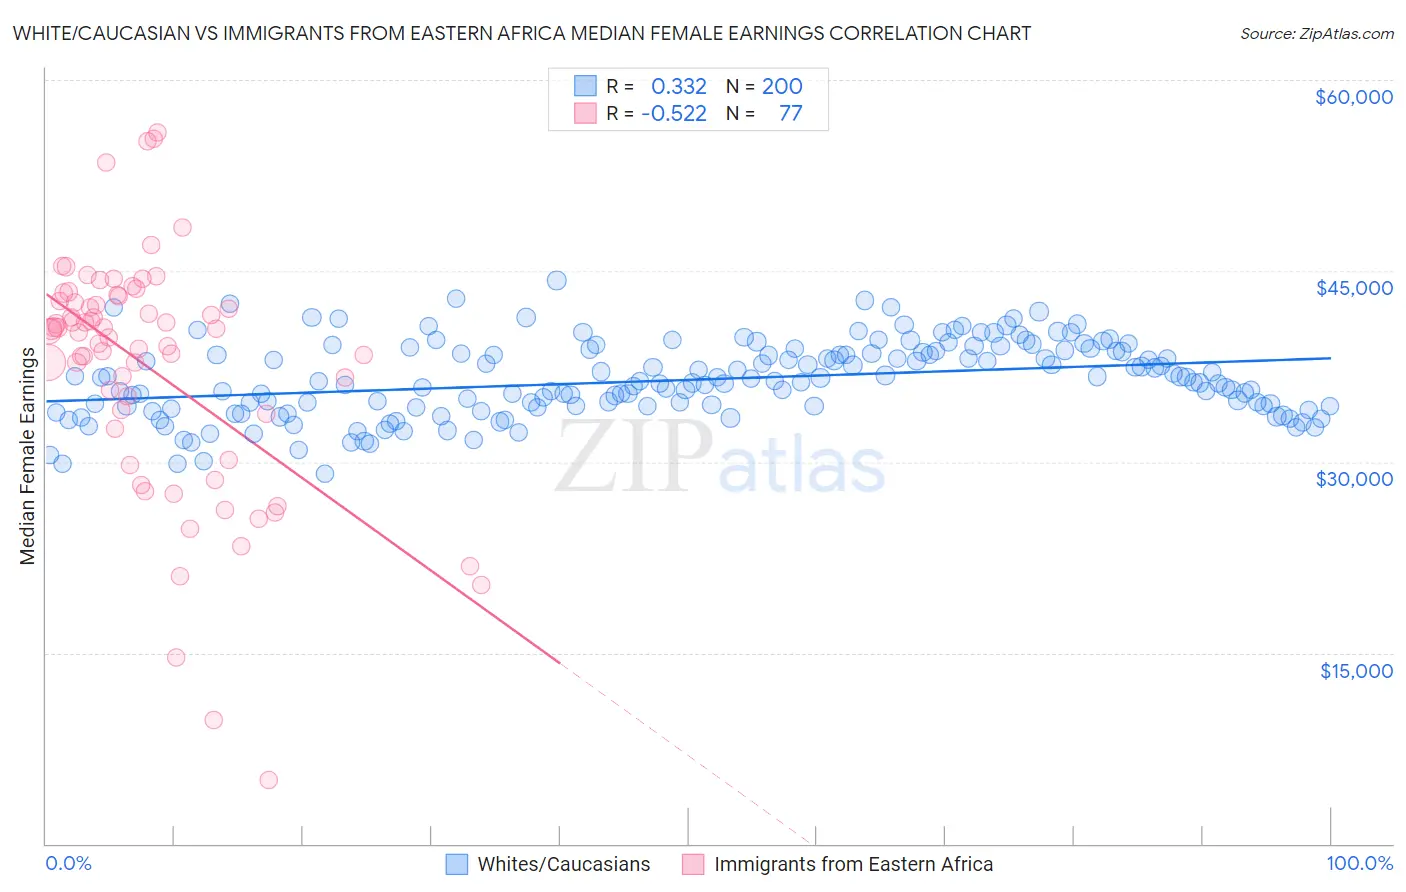
White/Caucasian vs Immigrants from Eastern Africa Median Female Earnings Correlation Chart
The statistical analysis conducted on geographies consisting of 581,839,033 people shows a mild positive correlation between the proportion of Whites/Caucasians and median female earnings in the United States with a correlation coefficient (R) of 0.332 and weighted average of $37,531. Similarly, the statistical analysis conducted on geographies consisting of 355,081,217 people shows a substantial negative correlation between the proportion of Immigrants from Eastern Africa and median female earnings in the United States with a correlation coefficient (R) of -0.522 and weighted average of $40,644, a difference of 8.3%.
Median Female Earnings Correlation Summary
| Measurement | White/Caucasian | Immigrants from Eastern Africa |
| Minimum | $29,061 | $5,000 |
| Maximum | $44,249 | $55,898 |
| Range | $15,187 | $50,898 |
| Mean | $36,445 | $37,373 |
| Median | $36,298 | $40,248 |
| Interquartile 25% (IQ1) | $34,375 | $33,197 |
| Interquartile 75% (IQ3) | $38,681 | $42,814 |
| Interquartile Range (IQR) | $4,306 | $9,617 |
| Standard Deviation (Sample) | $2,956 | $9,538 |
| Standard Deviation (Population) | $2,949 | $9,476 |
Similar Demographics by Median Female Earnings
Demographics Similar to Whites/Caucasians by Median Female Earnings
In terms of median female earnings, the demographic groups most similar to Whites/Caucasians are Colville ($37,514, a difference of 0.040%), Samoan ($37,498, a difference of 0.090%), Hawaiian ($37,497, a difference of 0.090%), Belizean ($37,429, a difference of 0.27%), and Scotch-Irish ($37,383, a difference of 0.39%).
| Demographics | Rating | Rank | Median Female Earnings |
| Immigrants | Somalia | 2.4 /100 | #247 | Tragic $37,914 |
| Alaskan Athabascans | 2.3 /100 | #248 | Tragic $37,905 |
| Swiss | 2.3 /100 | #249 | Tragic $37,904 |
| Immigrants | Iraq | 2.2 /100 | #250 | Tragic $37,864 |
| Welsh | 2.1 /100 | #251 | Tragic $37,856 |
| Immigrants | Dominica | 2.0 /100 | #252 | Tragic $37,825 |
| Danes | 1.6 /100 | #253 | Tragic $37,730 |
| Whites/Caucasians | 1.1 /100 | #254 | Tragic $37,531 |
| Colville | 1.1 /100 | #255 | Tragic $37,514 |
| Samoans | 1.0 /100 | #256 | Tragic $37,498 |
| Hawaiians | 1.0 /100 | #257 | Tragic $37,497 |
| Belizeans | 0.9 /100 | #258 | Tragic $37,429 |
| Scotch-Irish | 0.8 /100 | #259 | Tragic $37,383 |
| Dutch | 0.7 /100 | #260 | Tragic $37,339 |
| Malaysians | 0.7 /100 | #261 | Tragic $37,298 |
Demographics Similar to Immigrants from Eastern Africa by Median Female Earnings
In terms of median female earnings, the demographic groups most similar to Immigrants from Eastern Africa are Pakistani ($40,596, a difference of 0.12%), Immigrants from Nepal ($40,704, a difference of 0.15%), Taiwanese ($40,576, a difference of 0.17%), Arab ($40,718, a difference of 0.18%), and Syrian ($40,727, a difference of 0.20%).
| Demographics | Rating | Rank | Median Female Earnings |
| Zimbabweans | 90.8 /100 | #129 | Exceptional $40,798 |
| Immigrants | Guyana | 90.3 /100 | #130 | Exceptional $40,773 |
| Chileans | 90.0 /100 | #131 | Exceptional $40,757 |
| Immigrants | Uganda | 89.7 /100 | #132 | Excellent $40,739 |
| Syrians | 89.5 /100 | #133 | Excellent $40,727 |
| Arabs | 89.3 /100 | #134 | Excellent $40,718 |
| Immigrants | Nepal | 89.0 /100 | #135 | Excellent $40,704 |
| Immigrants | Eastern Africa | 87.7 /100 | #136 | Excellent $40,644 |
| Pakistanis | 86.6 /100 | #137 | Excellent $40,596 |
| Taiwanese | 86.1 /100 | #138 | Excellent $40,576 |
| Immigrants | South Eastern Asia | 85.7 /100 | #139 | Excellent $40,558 |
| Serbians | 85.2 /100 | #140 | Excellent $40,539 |
| Immigrants | Syria | 84.1 /100 | #141 | Excellent $40,499 |
| Sri Lankans | 84.0 /100 | #142 | Excellent $40,496 |
| Northern Europeans | 83.9 /100 | #143 | Excellent $40,491 |