Kiowa vs U.S. Virgin Islander Median Family Income
COMPARE
Kiowa
U.S. Virgin Islander
Median Family Income
Median Family Income Comparison
Kiowa
U.S. Virgin Islanders
$80,885
MEDIAN FAMILY INCOME
0.0/ 100
METRIC RATING
333rd/ 347
METRIC RANK
$85,294
MEDIAN FAMILY INCOME
0.0/ 100
METRIC RATING
308th/ 347
METRIC RANK
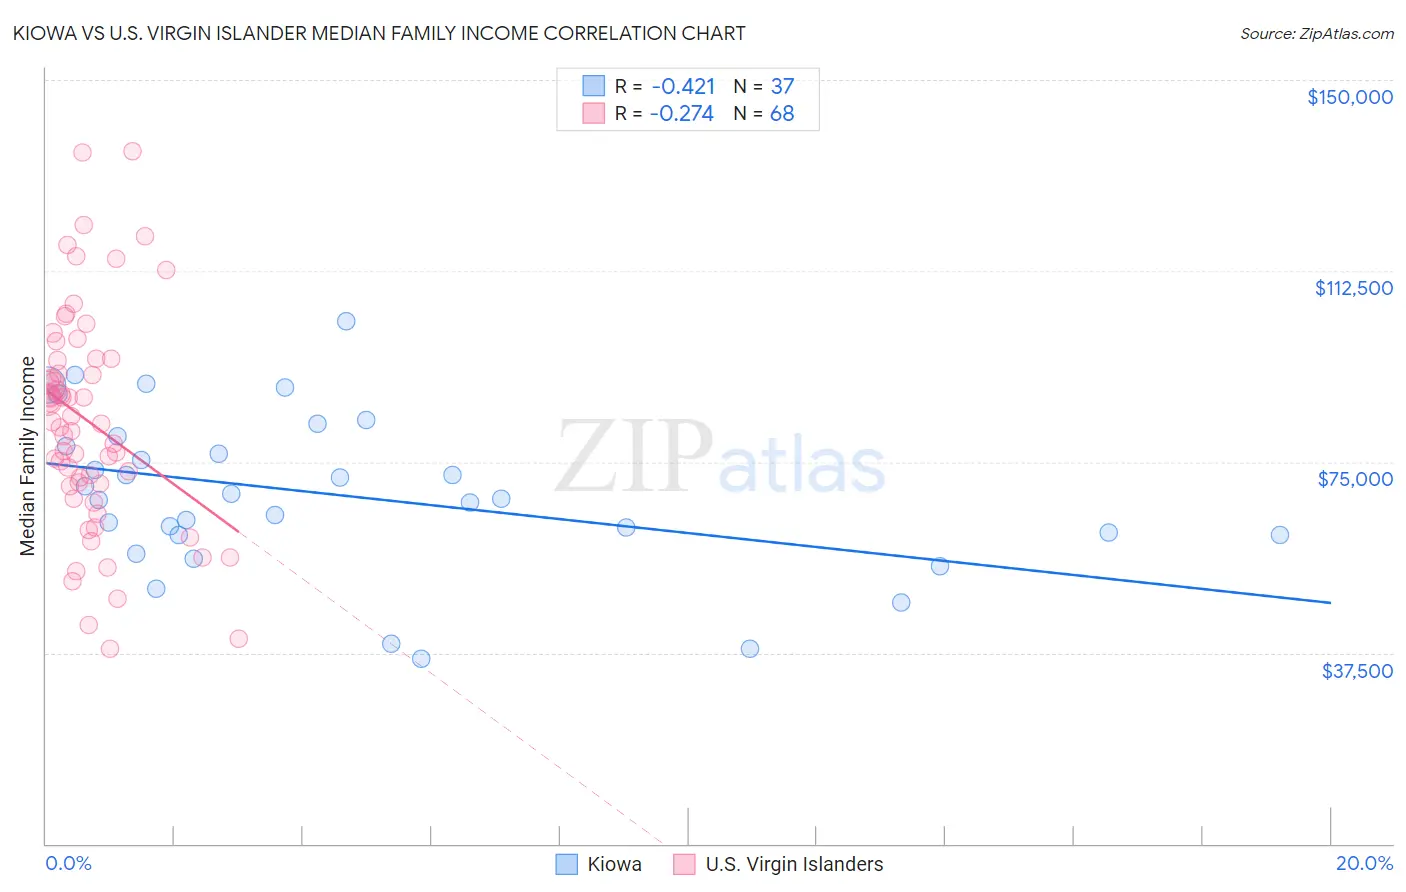
Kiowa vs U.S. Virgin Islander Median Family Income Correlation Chart
The statistical analysis conducted on geographies consisting of 56,095,481 people shows a moderate negative correlation between the proportion of Kiowa and median family income in the United States with a correlation coefficient (R) of -0.421 and weighted average of $80,885. Similarly, the statistical analysis conducted on geographies consisting of 87,505,006 people shows a weak negative correlation between the proportion of U.S. Virgin Islanders and median family income in the United States with a correlation coefficient (R) of -0.274 and weighted average of $85,294, a difference of 5.4%.
Median Family Income Correlation Summary
| Measurement | Kiowa | U.S. Virgin Islander |
| Minimum | $36,250 | $38,346 |
| Maximum | $102,708 | $136,000 |
| Range | $66,458 | $97,654 |
| Mean | $68,555 | $82,878 |
| Median | $67,750 | $82,757 |
| Interquartile 25% (IQ1) | $60,573 | $70,515 |
| Interquartile 75% (IQ3) | $79,021 | $95,033 |
| Interquartile Range (IQR) | $18,448 | $24,518 |
| Standard Deviation (Sample) | $15,572 | $21,454 |
| Standard Deviation (Population) | $15,360 | $21,296 |
Similar Demographics by Median Family Income
Demographics Similar to Kiowa by Median Family Income
In terms of median family income, the demographic groups most similar to Kiowa are Native/Alaskan ($80,908, a difference of 0.030%), Immigrants from Dominican Republic ($81,233, a difference of 0.43%), Cheyenne ($81,385, a difference of 0.62%), Dutch West Indian ($81,852, a difference of 1.2%), and Black/African American ($81,912, a difference of 1.3%).
| Demographics | Rating | Rank | Median Family Income |
| Immigrants | Congo | 0.0 /100 | #326 | Tragic $82,216 |
| Arapaho | 0.0 /100 | #327 | Tragic $82,064 |
| Blacks/African Americans | 0.0 /100 | #328 | Tragic $81,912 |
| Dutch West Indians | 0.0 /100 | #329 | Tragic $81,852 |
| Cheyenne | 0.0 /100 | #330 | Tragic $81,385 |
| Immigrants | Dominican Republic | 0.0 /100 | #331 | Tragic $81,233 |
| Natives/Alaskans | 0.0 /100 | #332 | Tragic $80,908 |
| Kiowa | 0.0 /100 | #333 | Tragic $80,885 |
| Menominee | 0.0 /100 | #334 | Tragic $79,563 |
| Yup'ik | 0.0 /100 | #335 | Tragic $79,290 |
| Immigrants | Cuba | 0.0 /100 | #336 | Tragic $78,249 |
| Yuman | 0.0 /100 | #337 | Tragic $78,055 |
| Immigrants | Yemen | 0.0 /100 | #338 | Tragic $77,457 |
| Pima | 0.0 /100 | #339 | Tragic $77,431 |
| Hopi | 0.0 /100 | #340 | Tragic $77,188 |
Demographics Similar to U.S. Virgin Islanders by Median Family Income
In terms of median family income, the demographic groups most similar to U.S. Virgin Islanders are Chickasaw ($85,356, a difference of 0.070%), Haitian ($85,218, a difference of 0.090%), Paiute ($85,414, a difference of 0.14%), Immigrants from Dominica ($85,411, a difference of 0.14%), and Immigrants from Central America ($85,050, a difference of 0.29%).
| Demographics | Rating | Rank | Median Family Income |
| Colville | 0.0 /100 | #301 | Tragic $85,792 |
| Spanish American Indians | 0.0 /100 | #302 | Tragic $85,728 |
| Hispanics or Latinos | 0.0 /100 | #303 | Tragic $85,647 |
| Mexicans | 0.0 /100 | #304 | Tragic $85,618 |
| Paiute | 0.0 /100 | #305 | Tragic $85,414 |
| Immigrants | Dominica | 0.0 /100 | #306 | Tragic $85,411 |
| Chickasaw | 0.0 /100 | #307 | Tragic $85,356 |
| U.S. Virgin Islanders | 0.0 /100 | #308 | Tragic $85,294 |
| Haitians | 0.0 /100 | #309 | Tragic $85,218 |
| Immigrants | Central America | 0.0 /100 | #310 | Tragic $85,050 |
| Hondurans | 0.0 /100 | #311 | Tragic $85,004 |
| Cubans | 0.0 /100 | #312 | Tragic $84,981 |
| Choctaw | 0.0 /100 | #313 | Tragic $84,835 |
| Immigrants | Bahamas | 0.0 /100 | #314 | Tragic $84,732 |
| Apache | 0.0 /100 | #315 | Tragic $84,451 |