Cambodian vs U.S. Virgin Islander Median Family Income
COMPARE
Cambodian
U.S. Virgin Islander
Median Family Income
Median Family Income Comparison
Cambodians
U.S. Virgin Islanders
$117,780
MEDIAN FAMILY INCOME
100.0/ 100
METRIC RATING
44th/ 347
METRIC RANK
$85,294
MEDIAN FAMILY INCOME
0.0/ 100
METRIC RATING
308th/ 347
METRIC RANK
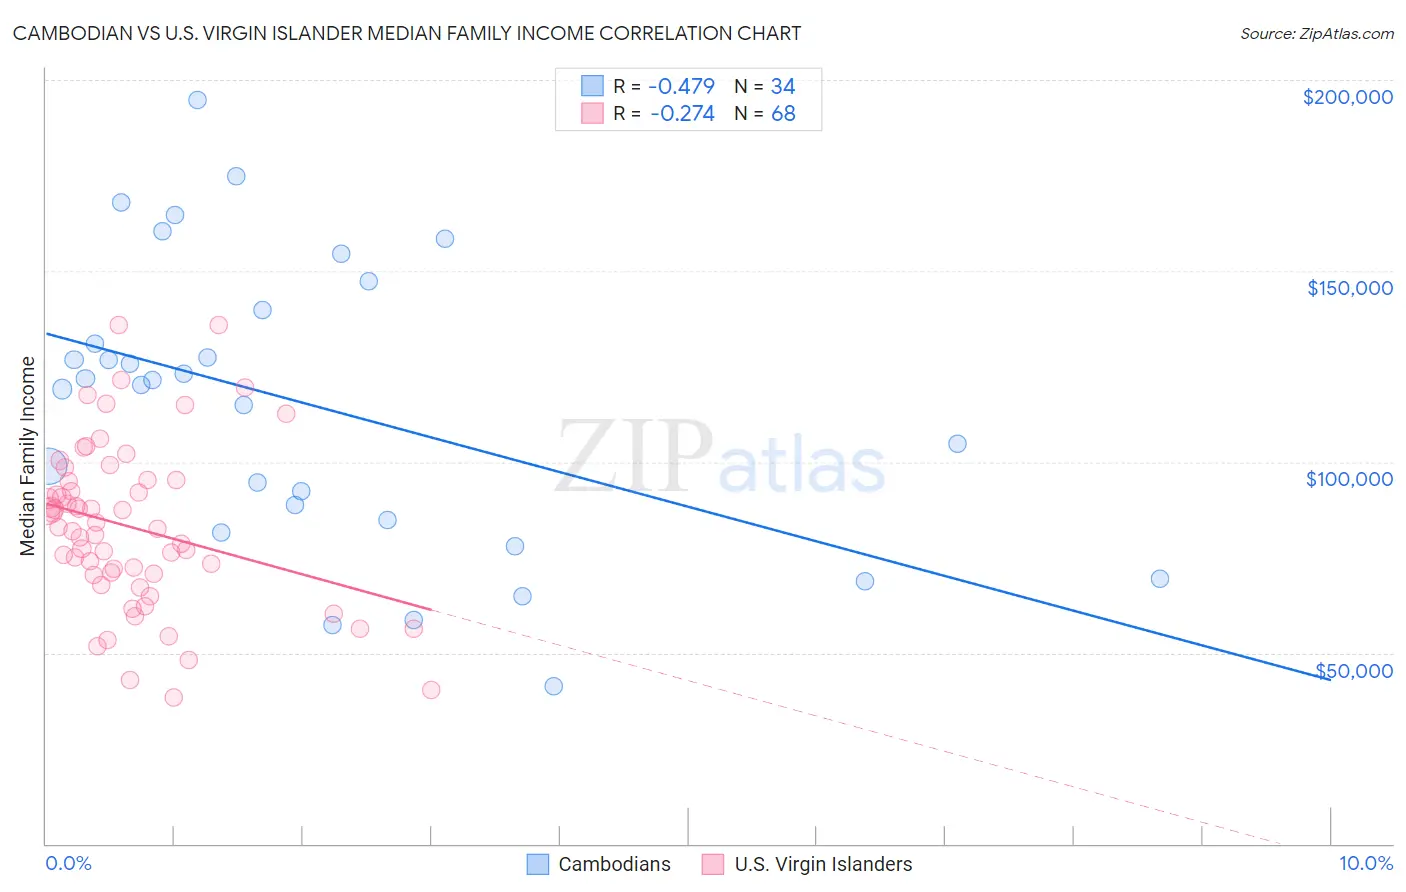
Cambodian vs U.S. Virgin Islander Median Family Income Correlation Chart
The statistical analysis conducted on geographies consisting of 102,461,045 people shows a moderate negative correlation between the proportion of Cambodians and median family income in the United States with a correlation coefficient (R) of -0.479 and weighted average of $117,780. Similarly, the statistical analysis conducted on geographies consisting of 87,505,006 people shows a weak negative correlation between the proportion of U.S. Virgin Islanders and median family income in the United States with a correlation coefficient (R) of -0.274 and weighted average of $85,294, a difference of 38.1%.
Median Family Income Correlation Summary
| Measurement | Cambodian | U.S. Virgin Islander |
| Minimum | $41,250 | $38,346 |
| Maximum | $194,752 | $136,000 |
| Range | $153,502 | $97,654 |
| Mean | $114,811 | $82,878 |
| Median | $120,749 | $82,757 |
| Interquartile 25% (IQ1) | $84,853 | $70,515 |
| Interquartile 75% (IQ3) | $139,722 | $95,033 |
| Interquartile Range (IQR) | $54,869 | $24,518 |
| Standard Deviation (Sample) | $37,903 | $21,454 |
| Standard Deviation (Population) | $37,342 | $21,296 |
Similar Demographics by Median Family Income
Demographics Similar to Cambodians by Median Family Income
In terms of median family income, the demographic groups most similar to Cambodians are Bulgarian ($117,818, a difference of 0.030%), Immigrants from Bolivia ($117,912, a difference of 0.11%), Estonian ($118,013, a difference of 0.20%), Immigrants from Lithuania ($118,053, a difference of 0.23%), and Immigrants from Greece ($117,344, a difference of 0.37%).
| Demographics | Rating | Rank | Median Family Income |
| Australians | 100.0 /100 | #37 | Exceptional $118,440 |
| Immigrants | Turkey | 100.0 /100 | #38 | Exceptional $118,325 |
| Immigrants | Asia | 100.0 /100 | #39 | Exceptional $118,291 |
| Immigrants | Lithuania | 100.0 /100 | #40 | Exceptional $118,053 |
| Estonians | 100.0 /100 | #41 | Exceptional $118,013 |
| Immigrants | Bolivia | 100.0 /100 | #42 | Exceptional $117,912 |
| Bulgarians | 100.0 /100 | #43 | Exceptional $117,818 |
| Cambodians | 100.0 /100 | #44 | Exceptional $117,780 |
| Immigrants | Greece | 99.9 /100 | #45 | Exceptional $117,344 |
| Immigrants | Russia | 99.9 /100 | #46 | Exceptional $116,942 |
| Immigrants | Austria | 99.9 /100 | #47 | Exceptional $116,830 |
| Immigrants | South Africa | 99.9 /100 | #48 | Exceptional $116,286 |
| Chinese | 99.9 /100 | #49 | Exceptional $116,188 |
| Immigrants | Czechoslovakia | 99.9 /100 | #50 | Exceptional $116,165 |
| Immigrants | Malaysia | 99.9 /100 | #51 | Exceptional $115,880 |
Demographics Similar to U.S. Virgin Islanders by Median Family Income
In terms of median family income, the demographic groups most similar to U.S. Virgin Islanders are Chickasaw ($85,356, a difference of 0.070%), Haitian ($85,218, a difference of 0.090%), Paiute ($85,414, a difference of 0.14%), Immigrants from Dominica ($85,411, a difference of 0.14%), and Immigrants from Central America ($85,050, a difference of 0.29%).
| Demographics | Rating | Rank | Median Family Income |
| Colville | 0.0 /100 | #301 | Tragic $85,792 |
| Spanish American Indians | 0.0 /100 | #302 | Tragic $85,728 |
| Hispanics or Latinos | 0.0 /100 | #303 | Tragic $85,647 |
| Mexicans | 0.0 /100 | #304 | Tragic $85,618 |
| Paiute | 0.0 /100 | #305 | Tragic $85,414 |
| Immigrants | Dominica | 0.0 /100 | #306 | Tragic $85,411 |
| Chickasaw | 0.0 /100 | #307 | Tragic $85,356 |
| U.S. Virgin Islanders | 0.0 /100 | #308 | Tragic $85,294 |
| Haitians | 0.0 /100 | #309 | Tragic $85,218 |
| Immigrants | Central America | 0.0 /100 | #310 | Tragic $85,050 |
| Hondurans | 0.0 /100 | #311 | Tragic $85,004 |
| Cubans | 0.0 /100 | #312 | Tragic $84,981 |
| Choctaw | 0.0 /100 | #313 | Tragic $84,835 |
| Immigrants | Bahamas | 0.0 /100 | #314 | Tragic $84,732 |
| Apache | 0.0 /100 | #315 | Tragic $84,451 |