Somali vs Tsimshian Wage/Income Gap
COMPARE
Somali
Tsimshian
Wage/Income Gap
Wage/Income Gap Comparison
Somalis
Tsimshian
21.2%
WAGE/INCOME GAP
100.0/ 100
METRIC RATING
35th/ 347
METRIC RANK
23.9%
WAGE/INCOME GAP
98.9/ 100
METRIC RATING
103rd/ 347
METRIC RANK
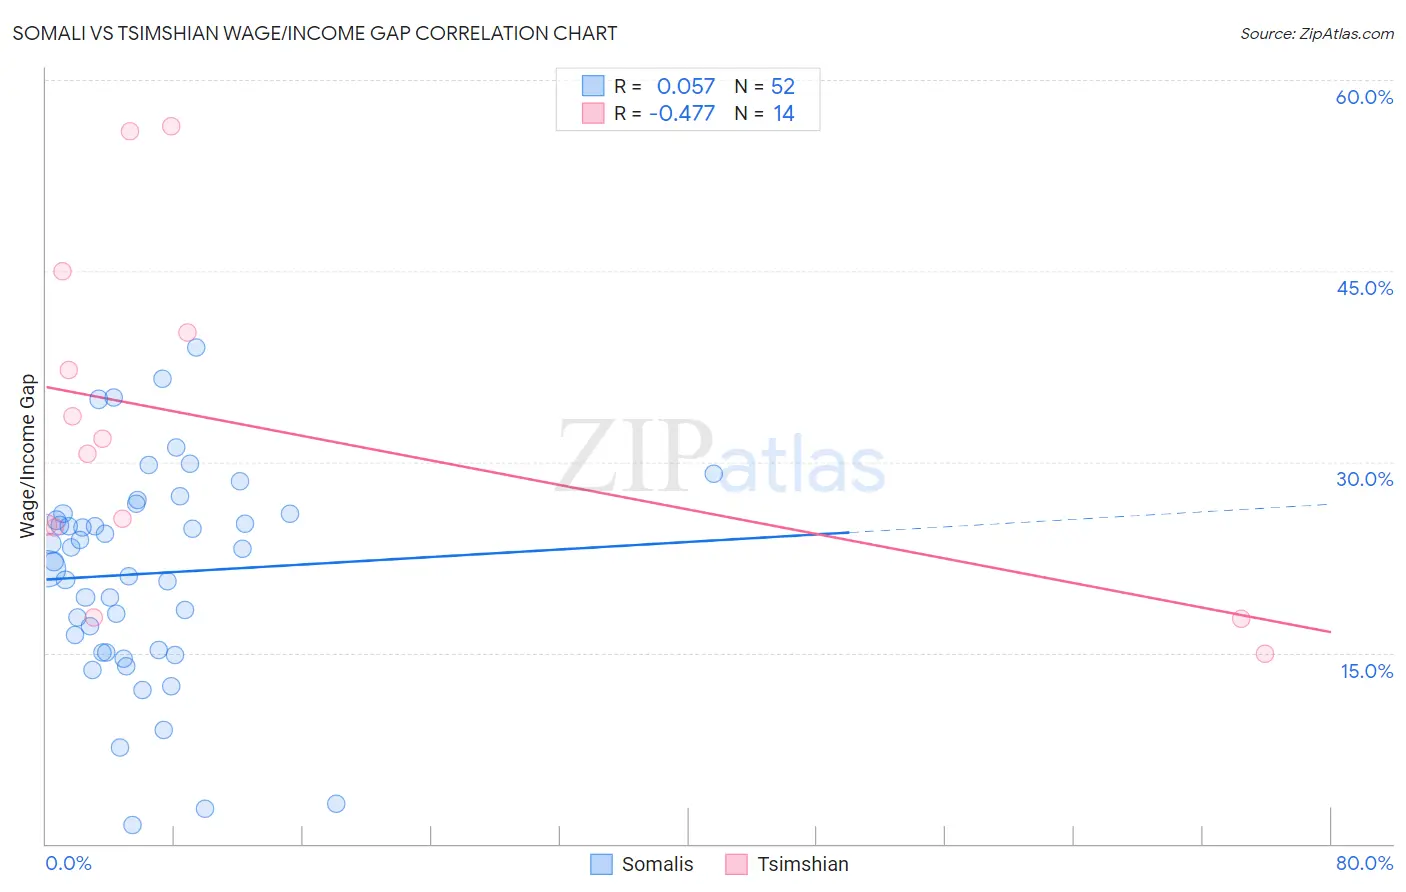
Somali vs Tsimshian Wage/Income Gap Correlation Chart
The statistical analysis conducted on geographies consisting of 99,316,309 people shows a slight positive correlation between the proportion of Somalis and wage/income gap percentage in the United States with a correlation coefficient (R) of 0.057 and weighted average of 21.2%. Similarly, the statistical analysis conducted on geographies consisting of 15,623,634 people shows a moderate negative correlation between the proportion of Tsimshian and wage/income gap percentage in the United States with a correlation coefficient (R) of -0.477 and weighted average of 23.9%, a difference of 12.5%.
Wage/Income Gap Correlation Summary
| Measurement | Somali | Tsimshian |
| Minimum | 1.5% | 14.9% |
| Maximum | 39.0% | 56.3% |
| Range | 37.5% | 41.4% |
| Mean | 21.2% | 32.6% |
| Median | 22.7% | 31.2% |
| Interquartile 25% (IQ1) | 15.2% | 24.9% |
| Interquartile 75% (IQ3) | 25.9% | 40.2% |
| Interquartile Range (IQR) | 10.8% | 15.3% |
| Standard Deviation (Sample) | 8.3% | 13.2% |
| Standard Deviation (Population) | 8.2% | 12.7% |
Similar Demographics by Wage/Income Gap
Demographics Similar to Somalis by Wage/Income Gap
In terms of wage/income gap, the demographic groups most similar to Somalis are Belizean (21.2%, a difference of 0.020%), Immigrants from Somalia (21.2%, a difference of 0.090%), Immigrants from Belize (21.3%, a difference of 0.14%), Colville (21.3%, a difference of 0.25%), and Lumbee (21.3%, a difference of 0.45%).
| Demographics | Rating | Rank | Wage/Income Gap |
| Inupiat | 100.0 /100 | #28 | Exceptional 20.8% |
| Immigrants | Senegal | 100.0 /100 | #29 | Exceptional 20.9% |
| Immigrants | Bangladesh | 100.0 /100 | #30 | Exceptional 20.9% |
| Vietnamese | 100.0 /100 | #31 | Exceptional 21.0% |
| Immigrants | Yemen | 100.0 /100 | #32 | Exceptional 21.1% |
| Immigrants | Bahamas | 100.0 /100 | #33 | Exceptional 21.1% |
| Pima | 100.0 /100 | #34 | Exceptional 21.1% |
| Somalis | 100.0 /100 | #35 | Exceptional 21.2% |
| Belizeans | 100.0 /100 | #36 | Exceptional 21.2% |
| Immigrants | Somalia | 100.0 /100 | #37 | Exceptional 21.2% |
| Immigrants | Belize | 100.0 /100 | #38 | Exceptional 21.3% |
| Colville | 100.0 /100 | #39 | Exceptional 21.3% |
| Lumbee | 100.0 /100 | #40 | Exceptional 21.3% |
| Liberians | 100.0 /100 | #41 | Exceptional 21.4% |
| Immigrants | Sierra Leone | 100.0 /100 | #42 | Exceptional 21.4% |
Demographics Similar to Tsimshian by Wage/Income Gap
In terms of wage/income gap, the demographic groups most similar to Tsimshian are Immigrants from Laos (23.8%, a difference of 0.23%), Tlingit-Haida (24.0%, a difference of 0.33%), Japanese (23.8%, a difference of 0.37%), Moroccan (24.0%, a difference of 0.39%), and Sudanese (24.0%, a difference of 0.39%).
| Demographics | Rating | Rank | Wage/Income Gap |
| Kiowa | 99.4 /100 | #96 | Exceptional 23.6% |
| Immigrants | Sudan | 99.4 /100 | #97 | Exceptional 23.6% |
| Immigrants | Latin America | 99.2 /100 | #98 | Exceptional 23.7% |
| Aleuts | 99.2 /100 | #99 | Exceptional 23.7% |
| Yakama | 99.2 /100 | #100 | Exceptional 23.7% |
| Japanese | 99.1 /100 | #101 | Exceptional 23.8% |
| Immigrants | Laos | 99.0 /100 | #102 | Exceptional 23.8% |
| Tsimshian | 98.9 /100 | #103 | Exceptional 23.9% |
| Tlingit-Haida | 98.7 /100 | #104 | Exceptional 24.0% |
| Moroccans | 98.6 /100 | #105 | Exceptional 24.0% |
| Sudanese | 98.6 /100 | #106 | Exceptional 24.0% |
| Yaqui | 98.4 /100 | #107 | Exceptional 24.0% |
| Immigrants | Albania | 98.4 /100 | #108 | Exceptional 24.0% |
| Ugandans | 98.3 /100 | #109 | Exceptional 24.1% |
| Immigrants | Morocco | 98.1 /100 | #110 | Exceptional 24.1% |