Ghanaian vs Tsimshian Wage/Income Gap
COMPARE
Ghanaian
Tsimshian
Wage/Income Gap
Wage/Income Gap Comparison
Ghanaians
Tsimshian
22.3%
WAGE/INCOME GAP
100.0/ 100
METRIC RATING
57th/ 347
METRIC RANK
23.9%
WAGE/INCOME GAP
98.9/ 100
METRIC RATING
103rd/ 347
METRIC RANK
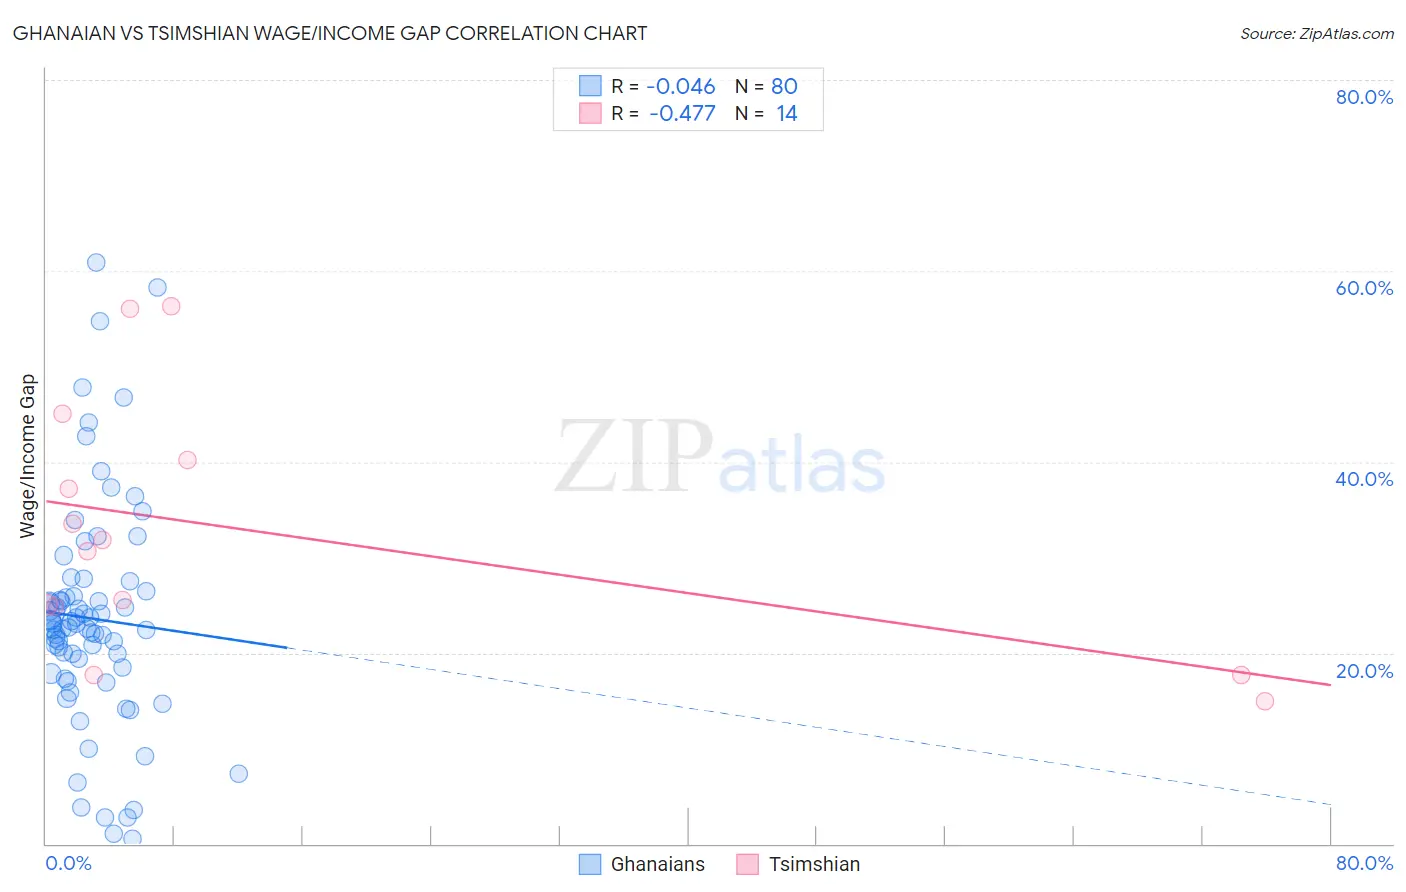
Ghanaian vs Tsimshian Wage/Income Gap Correlation Chart
The statistical analysis conducted on geographies consisting of 190,692,121 people shows no correlation between the proportion of Ghanaians and wage/income gap percentage in the United States with a correlation coefficient (R) of -0.046 and weighted average of 22.3%. Similarly, the statistical analysis conducted on geographies consisting of 15,623,634 people shows a moderate negative correlation between the proportion of Tsimshian and wage/income gap percentage in the United States with a correlation coefficient (R) of -0.477 and weighted average of 23.9%, a difference of 6.9%.
Wage/Income Gap Correlation Summary
| Measurement | Ghanaian | Tsimshian |
| Minimum | 0.52% | 14.9% |
| Maximum | 60.8% | 56.3% |
| Range | 60.3% | 41.4% |
| Mean | 23.6% | 32.6% |
| Median | 22.8% | 31.2% |
| Interquartile 25% (IQ1) | 18.1% | 24.9% |
| Interquartile 75% (IQ3) | 26.2% | 40.2% |
| Interquartile Range (IQR) | 8.0% | 15.3% |
| Standard Deviation (Sample) | 11.9% | 13.2% |
| Standard Deviation (Population) | 11.8% | 12.7% |
Similar Demographics by Wage/Income Gap
Demographics Similar to Ghanaians by Wage/Income Gap
In terms of wage/income gap, the demographic groups most similar to Ghanaians are Immigrants from Cuba (22.4%, a difference of 0.080%), Immigrants from Ghana (22.3%, a difference of 0.10%), Navajo (22.4%, a difference of 0.12%), Immigrants from Zaire (22.3%, a difference of 0.13%), and Immigrants from Middle Africa (22.4%, a difference of 0.14%).
| Demographics | Rating | Rank | Wage/Income Gap |
| Immigrants | Western Africa | 100.0 /100 | #50 | Exceptional 22.0% |
| Tohono O'odham | 100.0 /100 | #51 | Exceptional 22.1% |
| Immigrants | Cameroon | 100.0 /100 | #52 | Exceptional 22.2% |
| Bangladeshis | 100.0 /100 | #53 | Exceptional 22.2% |
| Nepalese | 100.0 /100 | #54 | Exceptional 22.2% |
| Immigrants | Zaire | 100.0 /100 | #55 | Exceptional 22.3% |
| Immigrants | Ghana | 100.0 /100 | #56 | Exceptional 22.3% |
| Ghanaians | 100.0 /100 | #57 | Exceptional 22.3% |
| Immigrants | Cuba | 100.0 /100 | #58 | Exceptional 22.4% |
| Navajo | 100.0 /100 | #59 | Exceptional 22.4% |
| Immigrants | Middle Africa | 100.0 /100 | #60 | Exceptional 22.4% |
| Immigrants | Fiji | 100.0 /100 | #61 | Exceptional 22.4% |
| Immigrants | Guatemala | 100.0 /100 | #62 | Exceptional 22.5% |
| Immigrants | Ecuador | 100.0 /100 | #63 | Exceptional 22.5% |
| Spanish American Indians | 100.0 /100 | #64 | Exceptional 22.5% |
Demographics Similar to Tsimshian by Wage/Income Gap
In terms of wage/income gap, the demographic groups most similar to Tsimshian are Immigrants from Laos (23.8%, a difference of 0.23%), Tlingit-Haida (24.0%, a difference of 0.33%), Japanese (23.8%, a difference of 0.37%), Moroccan (24.0%, a difference of 0.39%), and Sudanese (24.0%, a difference of 0.39%).
| Demographics | Rating | Rank | Wage/Income Gap |
| Kiowa | 99.4 /100 | #96 | Exceptional 23.6% |
| Immigrants | Sudan | 99.4 /100 | #97 | Exceptional 23.6% |
| Immigrants | Latin America | 99.2 /100 | #98 | Exceptional 23.7% |
| Aleuts | 99.2 /100 | #99 | Exceptional 23.7% |
| Yakama | 99.2 /100 | #100 | Exceptional 23.7% |
| Japanese | 99.1 /100 | #101 | Exceptional 23.8% |
| Immigrants | Laos | 99.0 /100 | #102 | Exceptional 23.8% |
| Tsimshian | 98.9 /100 | #103 | Exceptional 23.9% |
| Tlingit-Haida | 98.7 /100 | #104 | Exceptional 24.0% |
| Moroccans | 98.6 /100 | #105 | Exceptional 24.0% |
| Sudanese | 98.6 /100 | #106 | Exceptional 24.0% |
| Yaqui | 98.4 /100 | #107 | Exceptional 24.0% |
| Immigrants | Albania | 98.4 /100 | #108 | Exceptional 24.0% |
| Ugandans | 98.3 /100 | #109 | Exceptional 24.1% |
| Immigrants | Morocco | 98.1 /100 | #110 | Exceptional 24.1% |