Yugoslavian vs Tsimshian Wage/Income Gap
COMPARE
Yugoslavian
Tsimshian
Wage/Income Gap
Wage/Income Gap Comparison
Yugoslavians
Tsimshian
26.7%
WAGE/INCOME GAP
9.7/ 100
METRIC RATING
215th/ 347
METRIC RANK
23.9%
WAGE/INCOME GAP
98.9/ 100
METRIC RATING
103rd/ 347
METRIC RANK
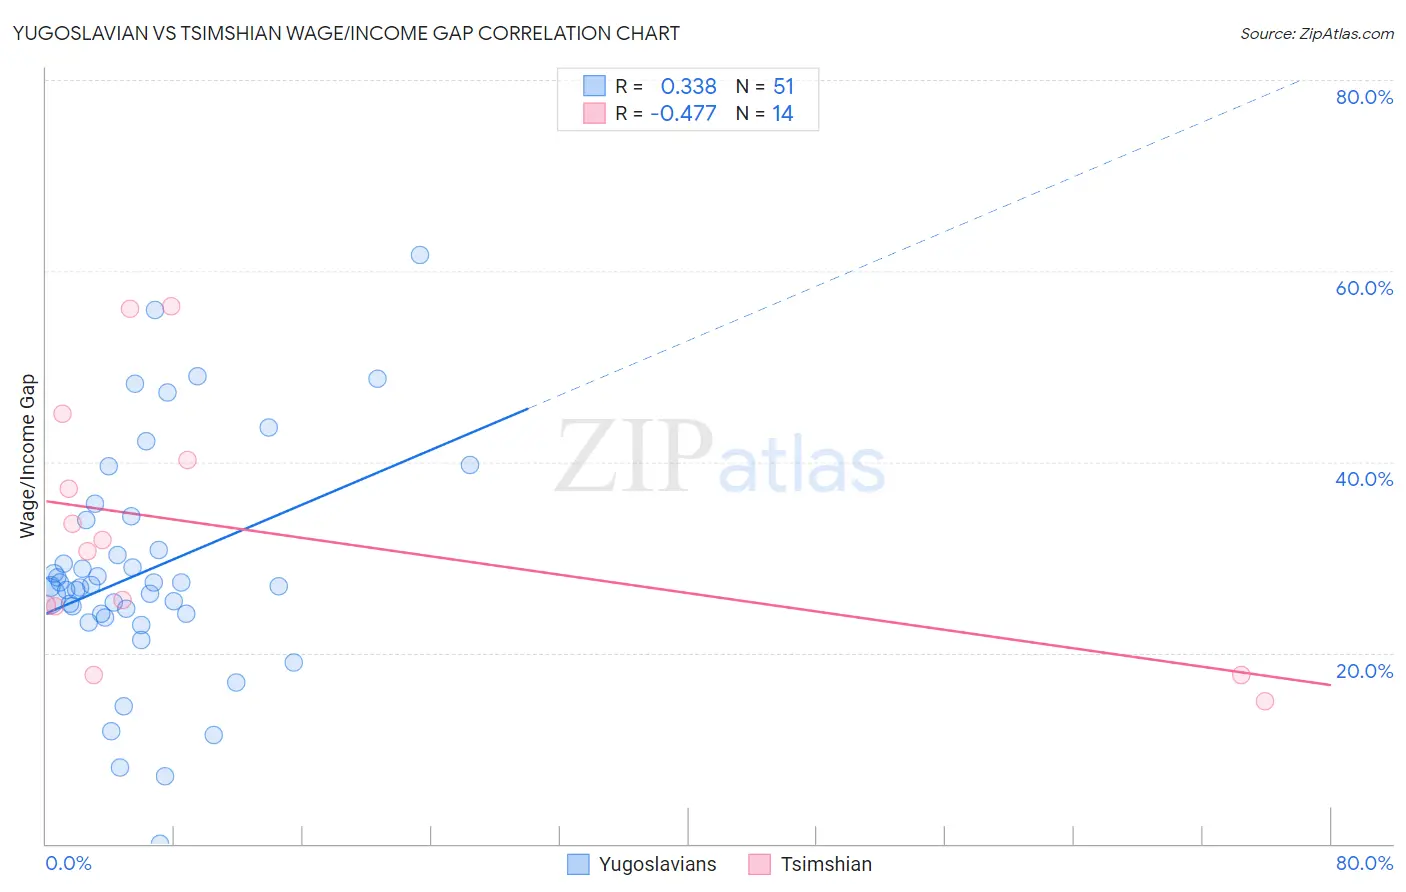
Yugoslavian vs Tsimshian Wage/Income Gap Correlation Chart
The statistical analysis conducted on geographies consisting of 285,593,717 people shows a mild positive correlation between the proportion of Yugoslavians and wage/income gap percentage in the United States with a correlation coefficient (R) of 0.338 and weighted average of 26.7%. Similarly, the statistical analysis conducted on geographies consisting of 15,623,634 people shows a moderate negative correlation between the proportion of Tsimshian and wage/income gap percentage in the United States with a correlation coefficient (R) of -0.477 and weighted average of 23.9%, a difference of 11.8%.
Wage/Income Gap Correlation Summary
| Measurement | Yugoslavian | Tsimshian |
| Minimum | 0.038% | 14.9% |
| Maximum | 61.7% | 56.3% |
| Range | 61.6% | 41.4% |
| Mean | 28.6% | 32.6% |
| Median | 27.0% | 31.2% |
| Interquartile 25% (IQ1) | 24.1% | 24.9% |
| Interquartile 75% (IQ3) | 33.9% | 40.2% |
| Interquartile Range (IQR) | 9.8% | 15.3% |
| Standard Deviation (Sample) | 12.0% | 13.2% |
| Standard Deviation (Population) | 11.8% | 12.7% |
Similar Demographics by Wage/Income Gap
Demographics Similar to Yugoslavians by Wage/Income Gap
In terms of wage/income gap, the demographic groups most similar to Yugoslavians are Immigrants from Portugal (26.7%, a difference of 0.040%), Immigrants from China (26.7%, a difference of 0.090%), Immigrants from Iraq (26.7%, a difference of 0.10%), Brazilian (26.7%, a difference of 0.10%), and Immigrants from Saudi Arabia (26.7%, a difference of 0.12%).
| Demographics | Rating | Rank | Wage/Income Gap |
| Egyptians | 12.7 /100 | #208 | Poor 26.6% |
| Immigrants | Kuwait | 12.6 /100 | #209 | Poor 26.6% |
| Arabs | 12.3 /100 | #210 | Poor 26.6% |
| Mongolians | 11.4 /100 | #211 | Poor 26.6% |
| Iraqis | 11.2 /100 | #212 | Poor 26.6% |
| Immigrants | Iraq | 10.3 /100 | #213 | Poor 26.7% |
| Immigrants | China | 10.3 /100 | #214 | Poor 26.7% |
| Yugoslavians | 9.7 /100 | #215 | Tragic 26.7% |
| Immigrants | Portugal | 9.5 /100 | #216 | Tragic 26.7% |
| Brazilians | 9.2 /100 | #217 | Tragic 26.7% |
| Immigrants | Saudi Arabia | 9.1 /100 | #218 | Tragic 26.7% |
| Immigrants | Poland | 8.9 /100 | #219 | Tragic 26.7% |
| Immigrants | Latvia | 8.9 /100 | #220 | Tragic 26.7% |
| Immigrants | Spain | 8.5 /100 | #221 | Tragic 26.8% |
| Bolivians | 8.3 /100 | #222 | Tragic 26.8% |
Demographics Similar to Tsimshian by Wage/Income Gap
In terms of wage/income gap, the demographic groups most similar to Tsimshian are Immigrants from Laos (23.8%, a difference of 0.23%), Tlingit-Haida (24.0%, a difference of 0.33%), Japanese (23.8%, a difference of 0.37%), Moroccan (24.0%, a difference of 0.39%), and Sudanese (24.0%, a difference of 0.39%).
| Demographics | Rating | Rank | Wage/Income Gap |
| Kiowa | 99.4 /100 | #96 | Exceptional 23.6% |
| Immigrants | Sudan | 99.4 /100 | #97 | Exceptional 23.6% |
| Immigrants | Latin America | 99.2 /100 | #98 | Exceptional 23.7% |
| Aleuts | 99.2 /100 | #99 | Exceptional 23.7% |
| Yakama | 99.2 /100 | #100 | Exceptional 23.7% |
| Japanese | 99.1 /100 | #101 | Exceptional 23.8% |
| Immigrants | Laos | 99.0 /100 | #102 | Exceptional 23.8% |
| Tsimshian | 98.9 /100 | #103 | Exceptional 23.9% |
| Tlingit-Haida | 98.7 /100 | #104 | Exceptional 24.0% |
| Moroccans | 98.6 /100 | #105 | Exceptional 24.0% |
| Sudanese | 98.6 /100 | #106 | Exceptional 24.0% |
| Yaqui | 98.4 /100 | #107 | Exceptional 24.0% |
| Immigrants | Albania | 98.4 /100 | #108 | Exceptional 24.0% |
| Ugandans | 98.3 /100 | #109 | Exceptional 24.1% |
| Immigrants | Morocco | 98.1 /100 | #110 | Exceptional 24.1% |