Scotch-Irish vs Turkish Median Household Income
COMPARE
Scotch-Irish
Turkish
Median Household Income
Median Household Income Comparison
Scotch-Irish
Turks
$80,972
MEDIAN HOUSEHOLD INCOME
6.6/ 100
METRIC RATING
225th/ 347
METRIC RANK
$99,389
MEDIAN HOUSEHOLD INCOME
100.0/ 100
METRIC RATING
31st/ 347
METRIC RANK
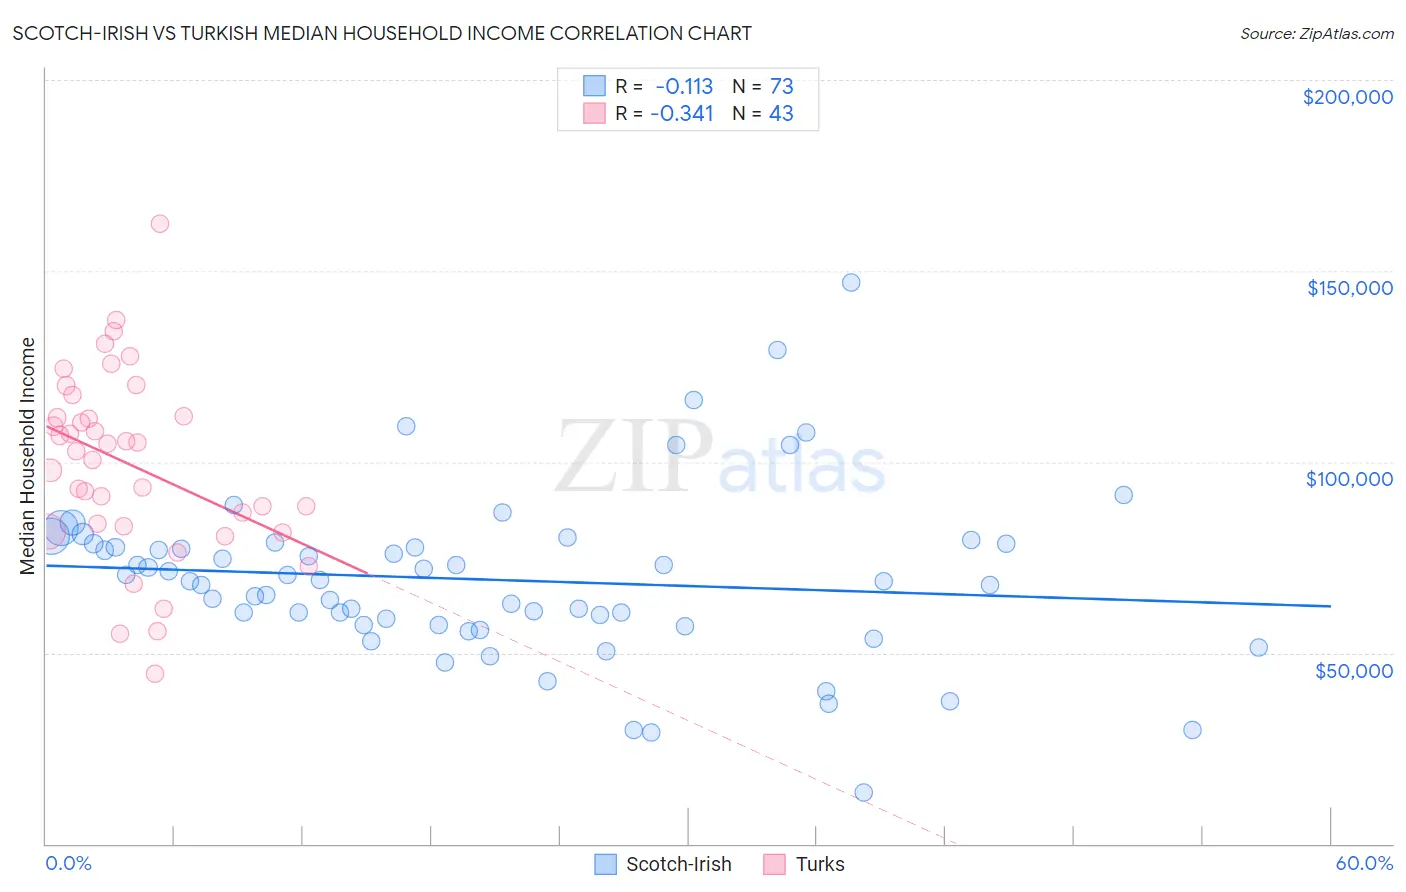
Scotch-Irish vs Turkish Median Household Income Correlation Chart
The statistical analysis conducted on geographies consisting of 548,026,119 people shows a poor negative correlation between the proportion of Scotch-Irish and median household income in the United States with a correlation coefficient (R) of -0.113 and weighted average of $80,972. Similarly, the statistical analysis conducted on geographies consisting of 271,658,597 people shows a mild negative correlation between the proportion of Turks and median household income in the United States with a correlation coefficient (R) of -0.341 and weighted average of $99,389, a difference of 22.8%.
Median Household Income Correlation Summary
| Measurement | Scotch-Irish | Turkish |
| Minimum | $13,333 | $44,531 |
| Maximum | $146,875 | $162,391 |
| Range | $133,542 | $117,860 |
| Mean | $69,187 | $99,338 |
| Median | $68,778 | $102,665 |
| Interquartile 25% (IQ1) | $57,401 | $83,043 |
| Interquartile 75% (IQ3) | $78,673 | $112,097 |
| Interquartile Range (IQR) | $21,272 | $29,054 |
| Standard Deviation (Sample) | $22,180 | $24,163 |
| Standard Deviation (Population) | $22,027 | $23,880 |
Similar Demographics by Median Household Income
Demographics Similar to Scotch-Irish by Median Household Income
In terms of median household income, the demographic groups most similar to Scotch-Irish are Malaysian ($81,064, a difference of 0.11%), Immigrants from Panama ($80,873, a difference of 0.12%), Guyanese ($80,734, a difference of 0.29%), Immigrants from El Salvador ($81,213, a difference of 0.30%), and Immigrants from Bangladesh ($80,722, a difference of 0.31%).
| Demographics | Rating | Rank | Median Household Income |
| Whites/Caucasians | 12.2 /100 | #218 | Poor $82,029 |
| Nigerians | 10.3 /100 | #219 | Poor $81,725 |
| Immigrants | Venezuela | 9.0 /100 | #220 | Tragic $81,506 |
| Immigrants | Ghana | 9.0 /100 | #221 | Tragic $81,489 |
| Immigrants | Nigeria | 7.7 /100 | #222 | Tragic $81,236 |
| Immigrants | El Salvador | 7.6 /100 | #223 | Tragic $81,213 |
| Malaysians | 7.0 /100 | #224 | Tragic $81,064 |
| Scotch-Irish | 6.6 /100 | #225 | Tragic $80,972 |
| Immigrants | Panama | 6.2 /100 | #226 | Tragic $80,873 |
| Guyanese | 5.7 /100 | #227 | Tragic $80,734 |
| Immigrants | Bangladesh | 5.7 /100 | #228 | Tragic $80,722 |
| Delaware | 5.0 /100 | #229 | Tragic $80,527 |
| Bermudans | 4.7 /100 | #230 | Tragic $80,406 |
| Trinidadians and Tobagonians | 4.7 /100 | #231 | Tragic $80,402 |
| Immigrants | Trinidad and Tobago | 4.6 /100 | #232 | Tragic $80,373 |
Demographics Similar to Turks by Median Household Income
In terms of median household income, the demographic groups most similar to Turks are Immigrants from Northern Europe ($99,813, a difference of 0.43%), Immigrants from Asia ($99,933, a difference of 0.55%), Immigrants from Sri Lanka ($99,943, a difference of 0.56%), Bhutanese ($100,151, a difference of 0.77%), and Immigrants from Denmark ($98,510, a difference of 0.89%).
| Demographics | Rating | Rank | Median Household Income |
| Immigrants | Japan | 100.0 /100 | #24 | Exceptional $100,711 |
| Immigrants | Sweden | 100.0 /100 | #25 | Exceptional $100,699 |
| Immigrants | Belgium | 100.0 /100 | #26 | Exceptional $100,306 |
| Bhutanese | 100.0 /100 | #27 | Exceptional $100,151 |
| Immigrants | Sri Lanka | 100.0 /100 | #28 | Exceptional $99,943 |
| Immigrants | Asia | 100.0 /100 | #29 | Exceptional $99,933 |
| Immigrants | Northern Europe | 100.0 /100 | #30 | Exceptional $99,813 |
| Turks | 100.0 /100 | #31 | Exceptional $99,389 |
| Immigrants | Denmark | 100.0 /100 | #32 | Exceptional $98,510 |
| Chinese | 100.0 /100 | #33 | Exceptional $98,496 |
| Russians | 100.0 /100 | #34 | Exceptional $98,008 |
| Immigrants | Switzerland | 100.0 /100 | #35 | Exceptional $97,979 |
| Immigrants | Pakistan | 100.0 /100 | #36 | Exceptional $97,528 |
| Latvians | 100.0 /100 | #37 | Exceptional $97,311 |
| Immigrants | Indonesia | 100.0 /100 | #38 | Exceptional $97,297 |