Scotch-Irish vs Cambodian Median Household Income
COMPARE
Scotch-Irish
Cambodian
Median Household Income
Median Household Income Comparison
Scotch-Irish
Cambodians
$80,972
MEDIAN HOUSEHOLD INCOME
6.6/ 100
METRIC RATING
225th/ 347
METRIC RANK
$96,324
MEDIAN HOUSEHOLD INCOME
99.9/ 100
METRIC RATING
48th/ 347
METRIC RANK
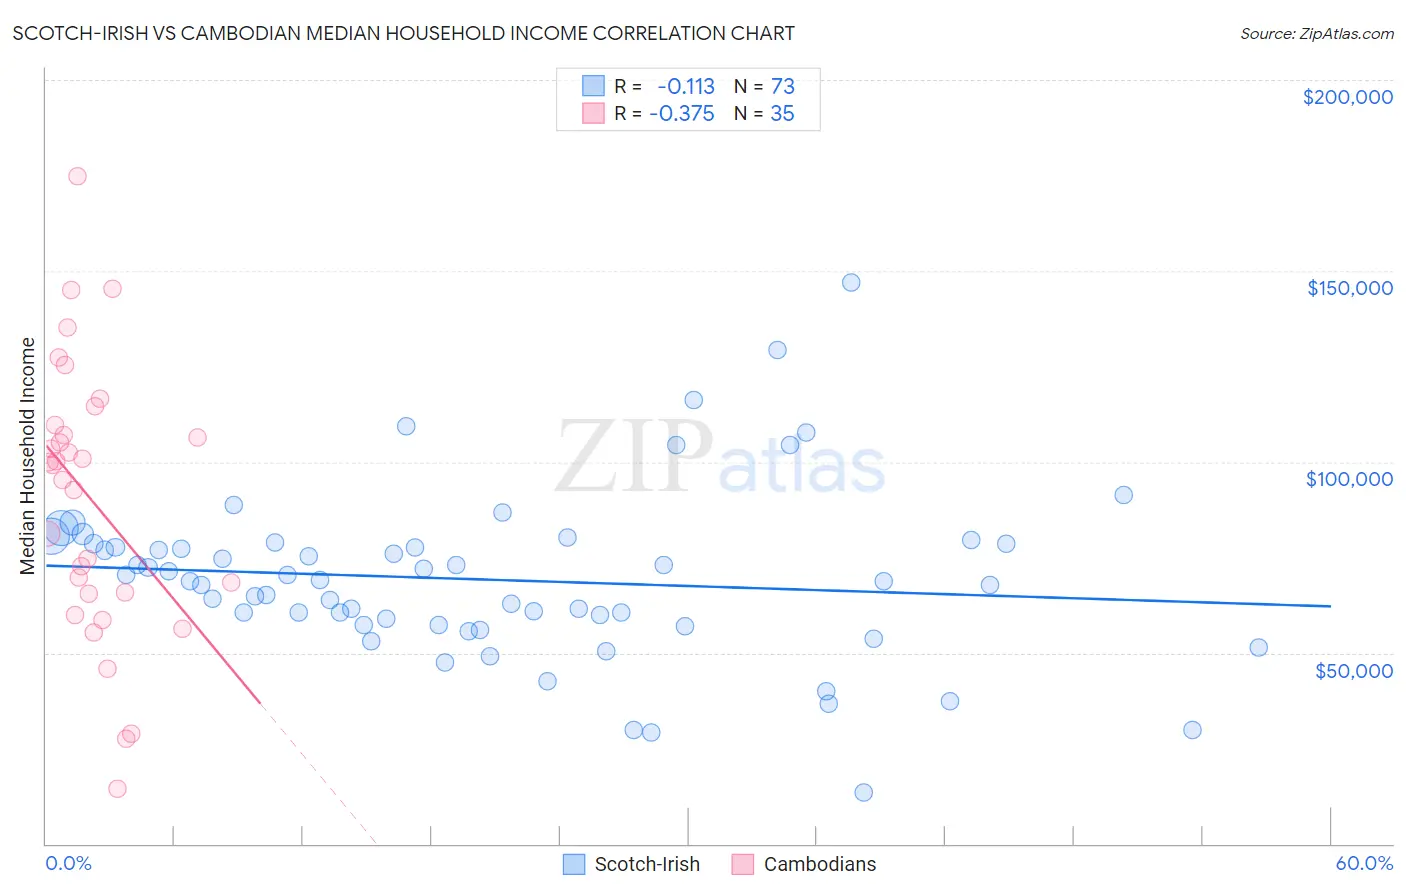
Scotch-Irish vs Cambodian Median Household Income Correlation Chart
The statistical analysis conducted on geographies consisting of 548,026,119 people shows a poor negative correlation between the proportion of Scotch-Irish and median household income in the United States with a correlation coefficient (R) of -0.113 and weighted average of $80,972. Similarly, the statistical analysis conducted on geographies consisting of 102,460,584 people shows a mild negative correlation between the proportion of Cambodians and median household income in the United States with a correlation coefficient (R) of -0.375 and weighted average of $96,324, a difference of 19.0%.
Median Household Income Correlation Summary
| Measurement | Scotch-Irish | Cambodian |
| Minimum | $13,333 | $14,319 |
| Maximum | $146,875 | $174,929 |
| Range | $133,542 | $160,610 |
| Mean | $69,187 | $90,039 |
| Median | $68,778 | $99,162 |
| Interquartile 25% (IQ1) | $57,401 | $65,313 |
| Interquartile 75% (IQ3) | $78,673 | $109,510 |
| Interquartile Range (IQR) | $21,272 | $44,197 |
| Standard Deviation (Sample) | $22,180 | $35,802 |
| Standard Deviation (Population) | $22,027 | $35,287 |
Similar Demographics by Median Household Income
Demographics Similar to Scotch-Irish by Median Household Income
In terms of median household income, the demographic groups most similar to Scotch-Irish are Malaysian ($81,064, a difference of 0.11%), Immigrants from Panama ($80,873, a difference of 0.12%), Guyanese ($80,734, a difference of 0.29%), Immigrants from El Salvador ($81,213, a difference of 0.30%), and Immigrants from Bangladesh ($80,722, a difference of 0.31%).
| Demographics | Rating | Rank | Median Household Income |
| Whites/Caucasians | 12.2 /100 | #218 | Poor $82,029 |
| Nigerians | 10.3 /100 | #219 | Poor $81,725 |
| Immigrants | Venezuela | 9.0 /100 | #220 | Tragic $81,506 |
| Immigrants | Ghana | 9.0 /100 | #221 | Tragic $81,489 |
| Immigrants | Nigeria | 7.7 /100 | #222 | Tragic $81,236 |
| Immigrants | El Salvador | 7.6 /100 | #223 | Tragic $81,213 |
| Malaysians | 7.0 /100 | #224 | Tragic $81,064 |
| Scotch-Irish | 6.6 /100 | #225 | Tragic $80,972 |
| Immigrants | Panama | 6.2 /100 | #226 | Tragic $80,873 |
| Guyanese | 5.7 /100 | #227 | Tragic $80,734 |
| Immigrants | Bangladesh | 5.7 /100 | #228 | Tragic $80,722 |
| Delaware | 5.0 /100 | #229 | Tragic $80,527 |
| Bermudans | 4.7 /100 | #230 | Tragic $80,406 |
| Trinidadians and Tobagonians | 4.7 /100 | #231 | Tragic $80,402 |
| Immigrants | Trinidad and Tobago | 4.6 /100 | #232 | Tragic $80,373 |
Demographics Similar to Cambodians by Median Household Income
In terms of median household income, the demographic groups most similar to Cambodians are Immigrants from Malaysia ($96,292, a difference of 0.030%), Bulgarian ($96,290, a difference of 0.040%), Immigrants from Russia ($96,378, a difference of 0.060%), Australian ($96,490, a difference of 0.17%), and Israeli ($96,552, a difference of 0.24%).
| Demographics | Rating | Rank | Median Household Income |
| Immigrants | Turkey | 100.0 /100 | #41 | Exceptional $96,964 |
| Immigrants | Lithuania | 99.9 /100 | #42 | Exceptional $96,836 |
| Immigrants | France | 99.9 /100 | #43 | Exceptional $96,743 |
| Immigrants | Greece | 99.9 /100 | #44 | Exceptional $96,675 |
| Israelis | 99.9 /100 | #45 | Exceptional $96,552 |
| Australians | 99.9 /100 | #46 | Exceptional $96,490 |
| Immigrants | Russia | 99.9 /100 | #47 | Exceptional $96,378 |
| Cambodians | 99.9 /100 | #48 | Exceptional $96,324 |
| Immigrants | Malaysia | 99.9 /100 | #49 | Exceptional $96,292 |
| Bulgarians | 99.9 /100 | #50 | Exceptional $96,290 |
| Estonians | 99.9 /100 | #51 | Exceptional $95,930 |
| Immigrants | South Africa | 99.9 /100 | #52 | Exceptional $95,800 |
| Paraguayans | 99.9 /100 | #53 | Exceptional $95,737 |
| Egyptians | 99.9 /100 | #54 | Exceptional $95,673 |
| Immigrants | Czechoslovakia | 99.9 /100 | #55 | Exceptional $95,319 |