Scotch-Irish vs Turkish Householder Income Under 25 years
COMPARE
Scotch-Irish
Turkish
Householder Income Under 25 years
Householder Income Under 25 years Comparison
Scotch-Irish
Turks
$49,039
HOUSEHOLDER INCOME UNDER 25 YEARS
0.0/ 100
METRIC RATING
285th/ 347
METRIC RANK
$54,266
HOUSEHOLDER INCOME UNDER 25 YEARS
99.4/ 100
METRIC RATING
90th/ 347
METRIC RANK
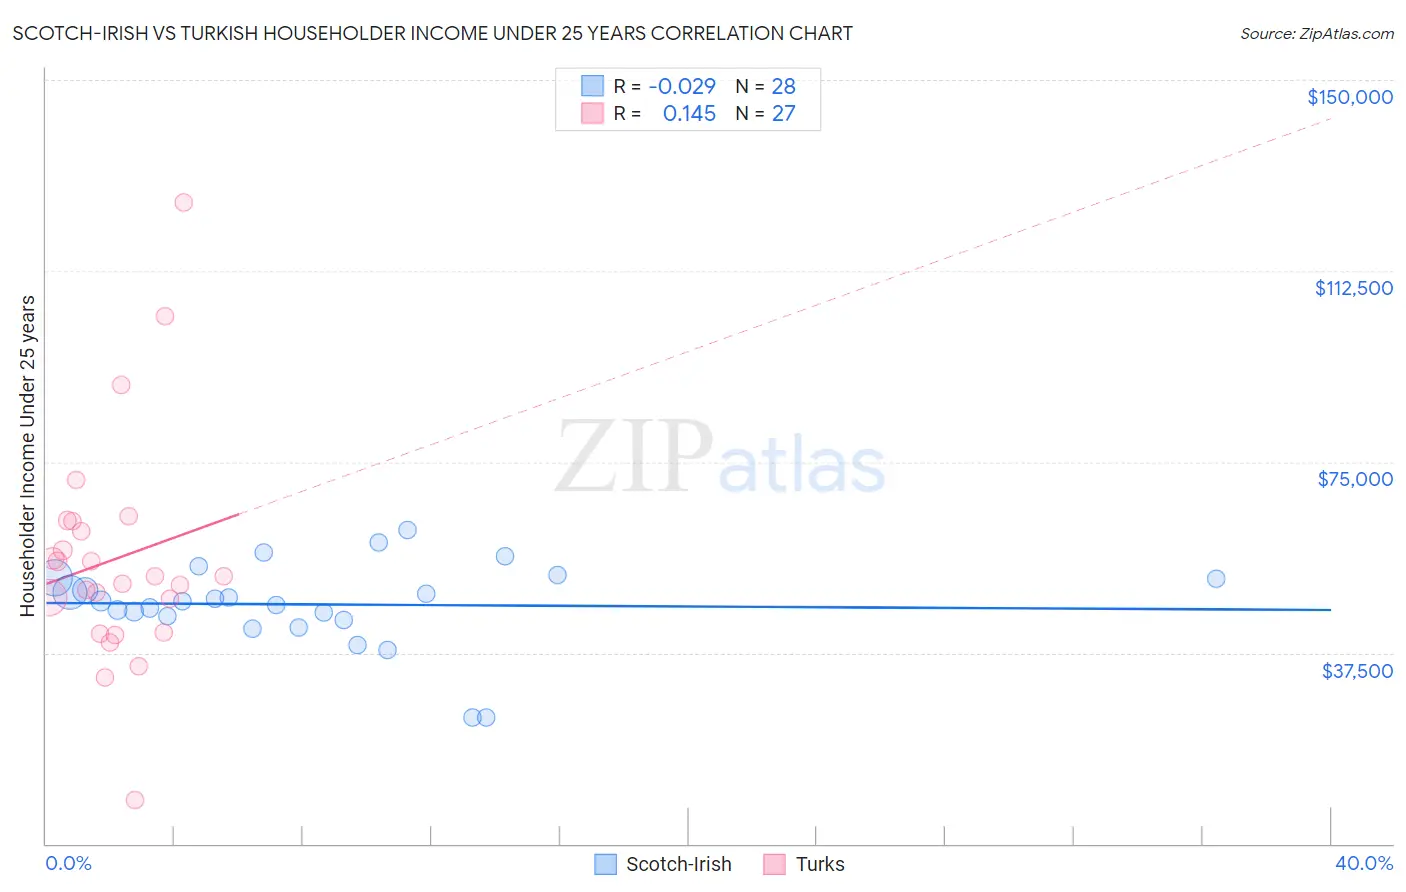
Scotch-Irish vs Turkish Householder Income Under 25 years Correlation Chart
The statistical analysis conducted on geographies consisting of 427,674,236 people shows no correlation between the proportion of Scotch-Irish and household income with householder under the age of 25 in the United States with a correlation coefficient (R) of -0.029 and weighted average of $49,039. Similarly, the statistical analysis conducted on geographies consisting of 234,402,010 people shows a poor positive correlation between the proportion of Turks and household income with householder under the age of 25 in the United States with a correlation coefficient (R) of 0.145 and weighted average of $54,266, a difference of 10.7%.
Householder Income Under 25 years Correlation Summary
| Measurement | Scotch-Irish | Turkish |
| Minimum | $24,821 | $8,508 |
| Maximum | $61,601 | $125,890 |
| Range | $36,780 | $117,382 |
| Mean | $47,004 | $55,917 |
| Median | $47,645 | $52,500 |
| Interquartile 25% (IQ1) | $44,331 | $41,438 |
| Interquartile 75% (IQ3) | $52,103 | $63,275 |
| Interquartile Range (IQR) | $7,772 | $21,837 |
| Standard Deviation (Sample) | $8,411 | $22,543 |
| Standard Deviation (Population) | $8,259 | $22,121 |
Similar Demographics by Householder Income Under 25 years
Demographics Similar to Scotch-Irish by Householder Income Under 25 years
In terms of householder income under 25 years, the demographic groups most similar to Scotch-Irish are French American Indian ($48,977, a difference of 0.13%), Carpatho Rusyn ($49,113, a difference of 0.15%), Senegalese ($48,953, a difference of 0.18%), Liberian ($48,917, a difference of 0.25%), and Immigrants from Nigeria ($49,174, a difference of 0.28%).
| Demographics | Rating | Rank | Householder Income Under 25 years |
| Nigerians | 0.1 /100 | #278 | Tragic $49,416 |
| Apache | 0.1 /100 | #279 | Tragic $49,395 |
| Hmong | 0.1 /100 | #280 | Tragic $49,364 |
| Immigrants | Nonimmigrants | 0.1 /100 | #281 | Tragic $49,348 |
| Alsatians | 0.1 /100 | #282 | Tragic $49,267 |
| Immigrants | Nigeria | 0.1 /100 | #283 | Tragic $49,174 |
| Carpatho Rusyns | 0.1 /100 | #284 | Tragic $49,113 |
| Scotch-Irish | 0.0 /100 | #285 | Tragic $49,039 |
| French American Indians | 0.0 /100 | #286 | Tragic $48,977 |
| Senegalese | 0.0 /100 | #287 | Tragic $48,953 |
| Liberians | 0.0 /100 | #288 | Tragic $48,917 |
| Hondurans | 0.0 /100 | #289 | Tragic $48,885 |
| Americans | 0.0 /100 | #290 | Tragic $48,860 |
| Immigrants | Burma/Myanmar | 0.0 /100 | #291 | Tragic $48,749 |
| Shoshone | 0.0 /100 | #292 | Tragic $48,720 |
Demographics Similar to Turks by Householder Income Under 25 years
In terms of householder income under 25 years, the demographic groups most similar to Turks are Immigrants from South America ($54,268, a difference of 0.0%), Immigrants from Egypt ($54,239, a difference of 0.050%), Immigrants from St. Vincent and the Grenadines ($54,230, a difference of 0.070%), Yakama ($54,321, a difference of 0.10%), and Immigrants from Argentina ($54,209, a difference of 0.10%).
| Demographics | Rating | Rank | Householder Income Under 25 years |
| Laotians | 99.5 /100 | #83 | Exceptional $54,369 |
| Bulgarians | 99.5 /100 | #84 | Exceptional $54,352 |
| Immigrants | Czechoslovakia | 99.5 /100 | #85 | Exceptional $54,352 |
| Immigrants | Croatia | 99.5 /100 | #86 | Exceptional $54,343 |
| Brazilians | 99.5 /100 | #87 | Exceptional $54,335 |
| Yakama | 99.5 /100 | #88 | Exceptional $54,321 |
| Immigrants | South America | 99.4 /100 | #89 | Exceptional $54,268 |
| Turks | 99.4 /100 | #90 | Exceptional $54,266 |
| Immigrants | Egypt | 99.3 /100 | #91 | Exceptional $54,239 |
| Immigrants | St. Vincent and the Grenadines | 99.3 /100 | #92 | Exceptional $54,230 |
| Immigrants | Argentina | 99.3 /100 | #93 | Exceptional $54,209 |
| Immigrants | Sierra Leone | 99.3 /100 | #94 | Exceptional $54,190 |
| Immigrants | Malaysia | 99.2 /100 | #95 | Exceptional $54,179 |
| Argentineans | 99.2 /100 | #96 | Exceptional $54,154 |
| Immigrants | Portugal | 99.1 /100 | #97 | Exceptional $54,105 |