Scotch-Irish vs Immigrants from Syria Median Household Income
COMPARE
Scotch-Irish
Immigrants from Syria
Median Household Income
Median Household Income Comparison
Scotch-Irish
Immigrants from Syria
$80,972
MEDIAN HOUSEHOLD INCOME
6.6/ 100
METRIC RATING
225th/ 347
METRIC RANK
$88,792
MEDIAN HOUSEHOLD INCOME
91.4/ 100
METRIC RATING
131st/ 347
METRIC RANK
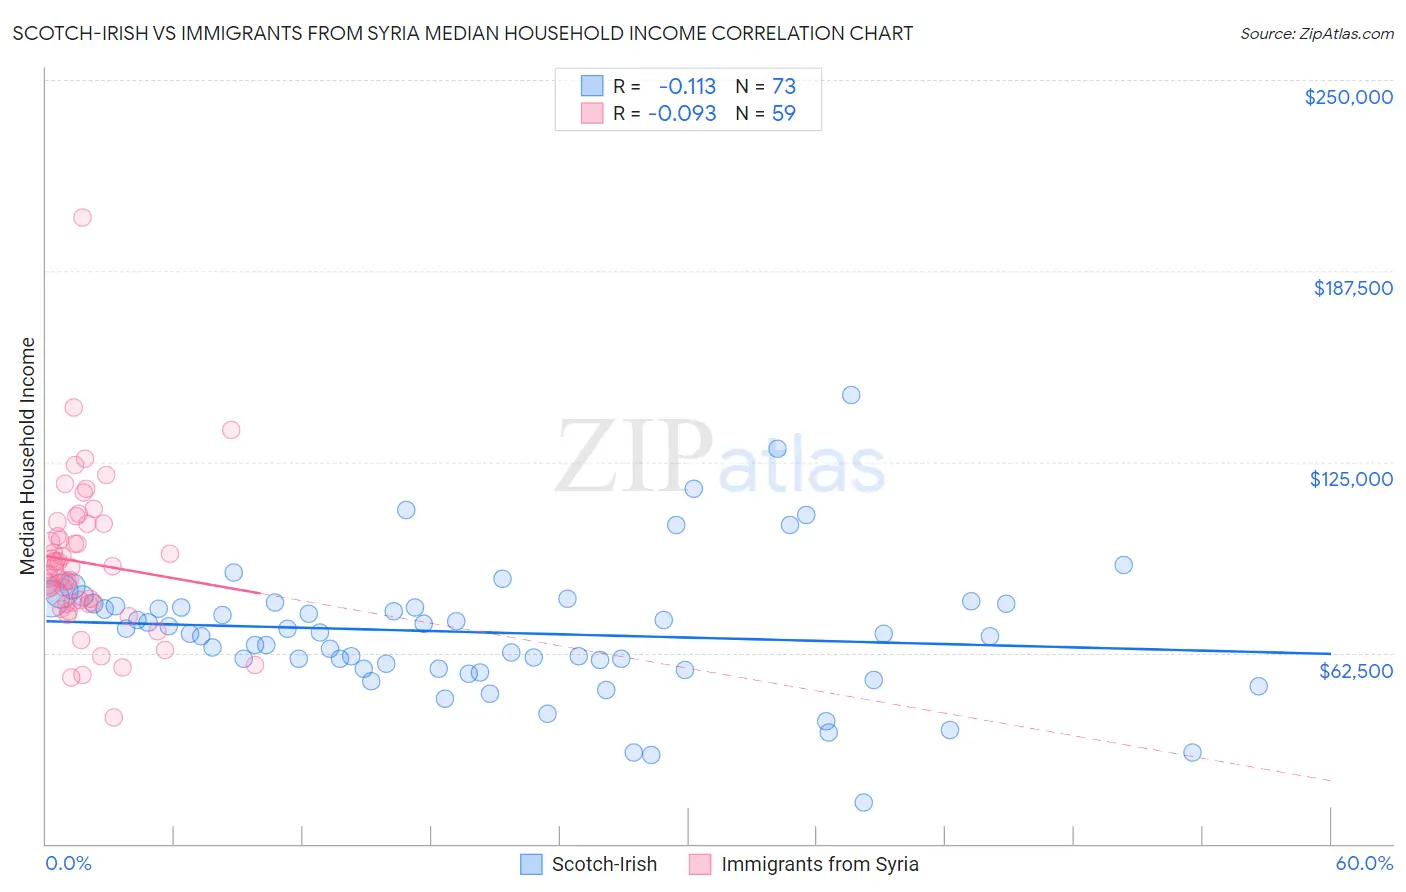
Scotch-Irish vs Immigrants from Syria Median Household Income Correlation Chart
The statistical analysis conducted on geographies consisting of 548,026,119 people shows a poor negative correlation between the proportion of Scotch-Irish and median household income in the United States with a correlation coefficient (R) of -0.113 and weighted average of $80,972. Similarly, the statistical analysis conducted on geographies consisting of 174,102,595 people shows a slight negative correlation between the proportion of Immigrants from Syria and median household income in the United States with a correlation coefficient (R) of -0.093 and weighted average of $88,792, a difference of 9.7%.
Median Household Income Correlation Summary
| Measurement | Scotch-Irish | Immigrants from Syria |
| Minimum | $13,333 | $41,250 |
| Maximum | $146,875 | $204,875 |
| Range | $133,542 | $163,625 |
| Mean | $69,187 | $92,001 |
| Median | $68,778 | $90,604 |
| Interquartile 25% (IQ1) | $57,401 | $78,558 |
| Interquartile 75% (IQ3) | $78,673 | $104,604 |
| Interquartile Range (IQR) | $21,272 | $26,046 |
| Standard Deviation (Sample) | $22,180 | $25,121 |
| Standard Deviation (Population) | $22,027 | $24,907 |
Similar Demographics by Median Household Income
Demographics Similar to Scotch-Irish by Median Household Income
In terms of median household income, the demographic groups most similar to Scotch-Irish are Malaysian ($81,064, a difference of 0.11%), Immigrants from Panama ($80,873, a difference of 0.12%), Guyanese ($80,734, a difference of 0.29%), Immigrants from El Salvador ($81,213, a difference of 0.30%), and Immigrants from Bangladesh ($80,722, a difference of 0.31%).
| Demographics | Rating | Rank | Median Household Income |
| Whites/Caucasians | 12.2 /100 | #218 | Poor $82,029 |
| Nigerians | 10.3 /100 | #219 | Poor $81,725 |
| Immigrants | Venezuela | 9.0 /100 | #220 | Tragic $81,506 |
| Immigrants | Ghana | 9.0 /100 | #221 | Tragic $81,489 |
| Immigrants | Nigeria | 7.7 /100 | #222 | Tragic $81,236 |
| Immigrants | El Salvador | 7.6 /100 | #223 | Tragic $81,213 |
| Malaysians | 7.0 /100 | #224 | Tragic $81,064 |
| Scotch-Irish | 6.6 /100 | #225 | Tragic $80,972 |
| Immigrants | Panama | 6.2 /100 | #226 | Tragic $80,873 |
| Guyanese | 5.7 /100 | #227 | Tragic $80,734 |
| Immigrants | Bangladesh | 5.7 /100 | #228 | Tragic $80,722 |
| Delaware | 5.0 /100 | #229 | Tragic $80,527 |
| Bermudans | 4.7 /100 | #230 | Tragic $80,406 |
| Trinidadians and Tobagonians | 4.7 /100 | #231 | Tragic $80,402 |
| Immigrants | Trinidad and Tobago | 4.6 /100 | #232 | Tragic $80,373 |
Demographics Similar to Immigrants from Syria by Median Household Income
In terms of median household income, the demographic groups most similar to Immigrants from Syria are European ($88,751, a difference of 0.050%), Immigrants from Ethiopia ($88,687, a difference of 0.12%), British ($88,914, a difference of 0.14%), Brazilian ($88,934, a difference of 0.16%), and Portuguese ($88,976, a difference of 0.21%).
| Demographics | Rating | Rank | Median Household Income |
| Immigrants | Jordan | 94.1 /100 | #124 | Exceptional $89,412 |
| Immigrants | Kuwait | 93.5 /100 | #125 | Exceptional $89,263 |
| Immigrants | Oceania | 92.9 /100 | #126 | Exceptional $89,100 |
| Immigrants | Peru | 92.5 /100 | #127 | Exceptional $89,010 |
| Portuguese | 92.3 /100 | #128 | Exceptional $88,976 |
| Brazilians | 92.1 /100 | #129 | Exceptional $88,934 |
| British | 92.0 /100 | #130 | Exceptional $88,914 |
| Immigrants | Syria | 91.4 /100 | #131 | Exceptional $88,792 |
| Europeans | 91.2 /100 | #132 | Exceptional $88,751 |
| Immigrants | Ethiopia | 90.9 /100 | #133 | Exceptional $88,687 |
| Swedes | 90.0 /100 | #134 | Exceptional $88,524 |
| Immigrants | Sierra Leone | 89.9 /100 | #135 | Excellent $88,498 |
| Poles | 89.7 /100 | #136 | Excellent $88,472 |
| Sierra Leoneans | 89.6 /100 | #137 | Excellent $88,463 |
| Arabs | 89.2 /100 | #138 | Excellent $88,398 |