Palestinian vs Cambodian Median Household Income
COMPARE
Palestinian
Cambodian
Median Household Income
Median Household Income Comparison
Palestinians
Cambodians
$90,574
MEDIAN HOUSEHOLD INCOME
97.1/ 100
METRIC RATING
110th/ 347
METRIC RANK
$96,324
MEDIAN HOUSEHOLD INCOME
99.9/ 100
METRIC RATING
48th/ 347
METRIC RANK
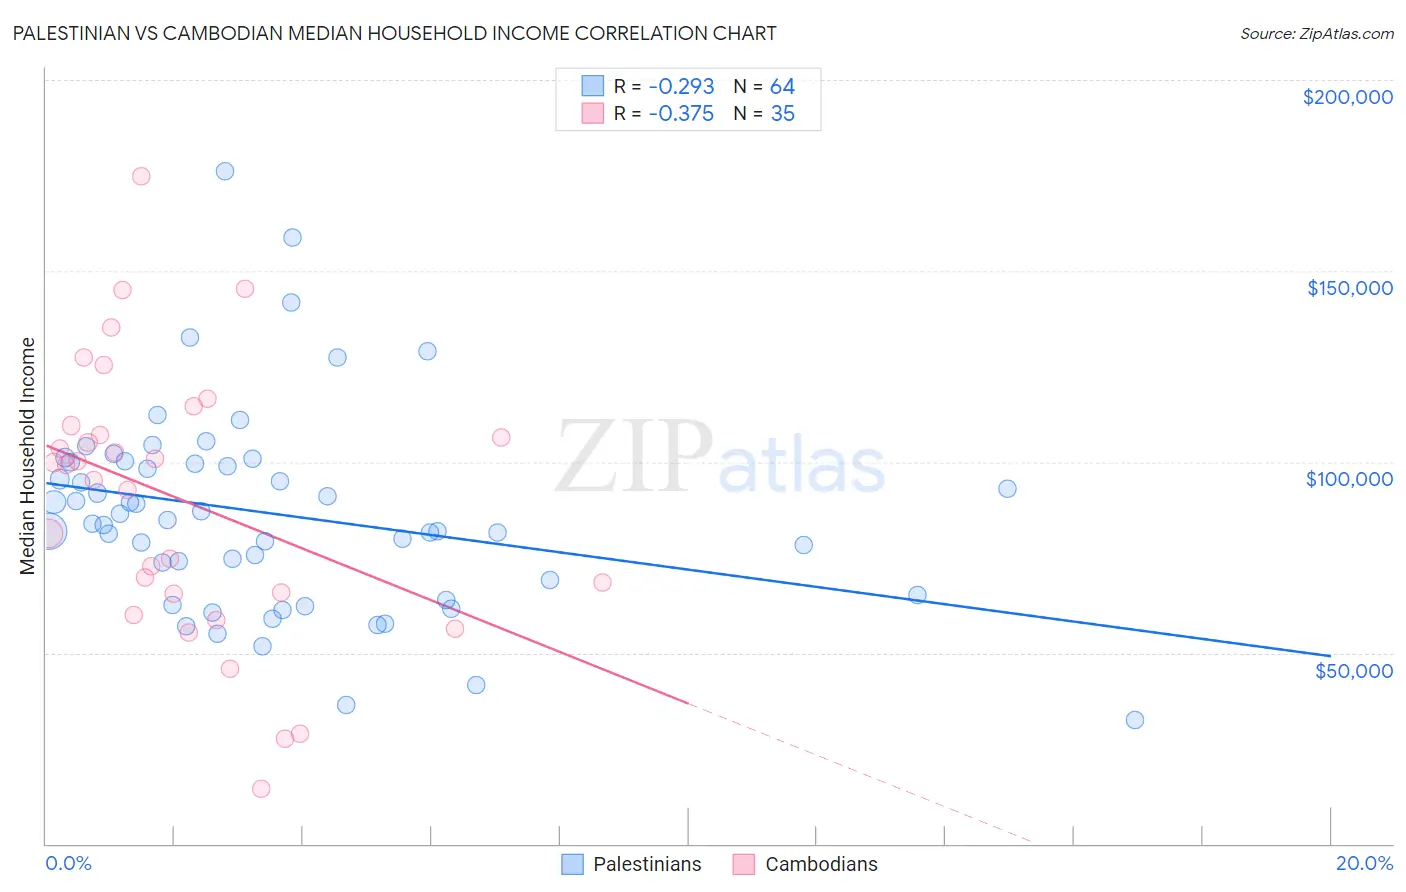
Palestinian vs Cambodian Median Household Income Correlation Chart
The statistical analysis conducted on geographies consisting of 216,355,198 people shows a weak negative correlation between the proportion of Palestinians and median household income in the United States with a correlation coefficient (R) of -0.293 and weighted average of $90,574. Similarly, the statistical analysis conducted on geographies consisting of 102,460,584 people shows a mild negative correlation between the proportion of Cambodians and median household income in the United States with a correlation coefficient (R) of -0.375 and weighted average of $96,324, a difference of 6.4%.
Median Household Income Correlation Summary
| Measurement | Palestinian | Cambodian |
| Minimum | $32,375 | $14,319 |
| Maximum | $176,058 | $174,929 |
| Range | $143,683 | $160,610 |
| Mean | $86,299 | $90,039 |
| Median | $84,304 | $99,162 |
| Interquartile 25% (IQ1) | $67,018 | $65,313 |
| Interquartile 75% (IQ3) | $99,711 | $109,510 |
| Interquartile Range (IQR) | $32,693 | $44,197 |
| Standard Deviation (Sample) | $26,509 | $35,802 |
| Standard Deviation (Population) | $26,301 | $35,287 |
Similar Demographics by Median Household Income
Demographics Similar to Palestinians by Median Household Income
In terms of median household income, the demographic groups most similar to Palestinians are Chilean ($90,605, a difference of 0.030%), Immigrants from Poland ($90,549, a difference of 0.030%), Zimbabwean ($90,618, a difference of 0.050%), Croatian ($90,685, a difference of 0.12%), and Northern European ($90,446, a difference of 0.14%).
| Demographics | Rating | Rank | Median Household Income |
| Immigrants | Ukraine | 98.0 /100 | #103 | Exceptional $91,124 |
| Immigrants | Kazakhstan | 97.8 /100 | #104 | Exceptional $91,015 |
| Immigrants | Brazil | 97.7 /100 | #105 | Exceptional $90,907 |
| Macedonians | 97.4 /100 | #106 | Exceptional $90,761 |
| Croatians | 97.3 /100 | #107 | Exceptional $90,685 |
| Zimbabweans | 97.2 /100 | #108 | Exceptional $90,618 |
| Chileans | 97.2 /100 | #109 | Exceptional $90,605 |
| Palestinians | 97.1 /100 | #110 | Exceptional $90,574 |
| Immigrants | Poland | 97.1 /100 | #111 | Exceptional $90,549 |
| Northern Europeans | 96.9 /100 | #112 | Exceptional $90,446 |
| Peruvians | 96.5 /100 | #113 | Exceptional $90,261 |
| Immigrants | Northern Africa | 95.9 /100 | #114 | Exceptional $90,026 |
| Immigrants | Western Asia | 95.9 /100 | #115 | Exceptional $90,005 |
| Native Hawaiians | 95.7 /100 | #116 | Exceptional $89,919 |
| Taiwanese | 95.6 /100 | #117 | Exceptional $89,900 |
Demographics Similar to Cambodians by Median Household Income
In terms of median household income, the demographic groups most similar to Cambodians are Immigrants from Malaysia ($96,292, a difference of 0.030%), Bulgarian ($96,290, a difference of 0.040%), Immigrants from Russia ($96,378, a difference of 0.060%), Australian ($96,490, a difference of 0.17%), and Israeli ($96,552, a difference of 0.24%).
| Demographics | Rating | Rank | Median Household Income |
| Immigrants | Turkey | 100.0 /100 | #41 | Exceptional $96,964 |
| Immigrants | Lithuania | 99.9 /100 | #42 | Exceptional $96,836 |
| Immigrants | France | 99.9 /100 | #43 | Exceptional $96,743 |
| Immigrants | Greece | 99.9 /100 | #44 | Exceptional $96,675 |
| Israelis | 99.9 /100 | #45 | Exceptional $96,552 |
| Australians | 99.9 /100 | #46 | Exceptional $96,490 |
| Immigrants | Russia | 99.9 /100 | #47 | Exceptional $96,378 |
| Cambodians | 99.9 /100 | #48 | Exceptional $96,324 |
| Immigrants | Malaysia | 99.9 /100 | #49 | Exceptional $96,292 |
| Bulgarians | 99.9 /100 | #50 | Exceptional $96,290 |
| Estonians | 99.9 /100 | #51 | Exceptional $95,930 |
| Immigrants | South Africa | 99.9 /100 | #52 | Exceptional $95,800 |
| Paraguayans | 99.9 /100 | #53 | Exceptional $95,737 |
| Egyptians | 99.9 /100 | #54 | Exceptional $95,673 |
| Immigrants | Czechoslovakia | 99.9 /100 | #55 | Exceptional $95,319 |