Immigrants from Turkey vs Cambodian Median Household Income
COMPARE
Immigrants from Turkey
Cambodian
Median Household Income
Median Household Income Comparison
Immigrants from Turkey
Cambodians
$96,964
MEDIAN HOUSEHOLD INCOME
100.0/ 100
METRIC RATING
41st/ 347
METRIC RANK
$96,324
MEDIAN HOUSEHOLD INCOME
99.9/ 100
METRIC RATING
48th/ 347
METRIC RANK
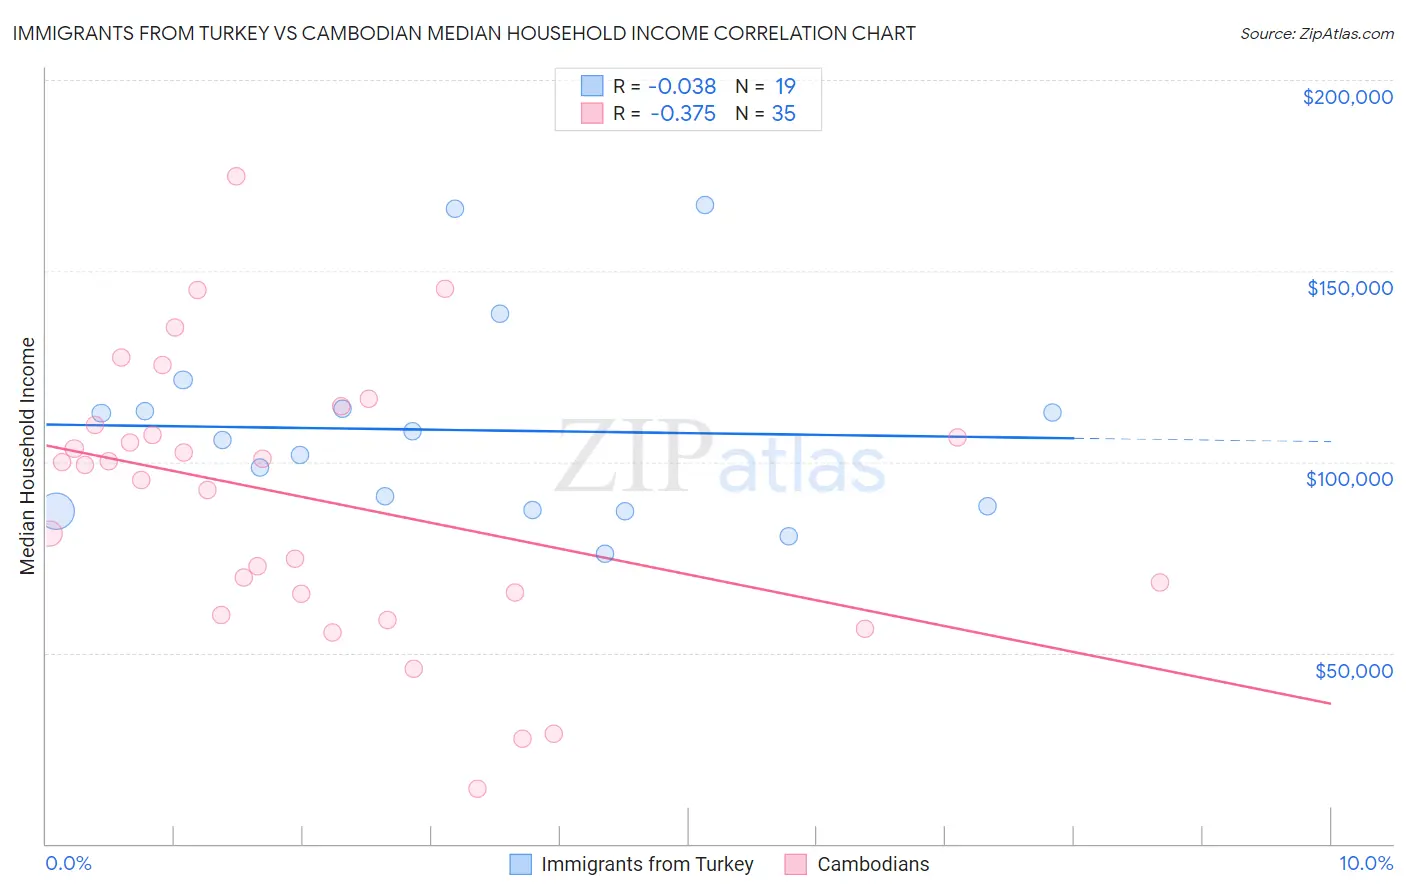
Immigrants from Turkey vs Cambodian Median Household Income Correlation Chart
The statistical analysis conducted on geographies consisting of 222,938,856 people shows no correlation between the proportion of Immigrants from Turkey and median household income in the United States with a correlation coefficient (R) of -0.038 and weighted average of $96,964. Similarly, the statistical analysis conducted on geographies consisting of 102,460,584 people shows a mild negative correlation between the proportion of Cambodians and median household income in the United States with a correlation coefficient (R) of -0.375 and weighted average of $96,324, a difference of 0.66%.
Median Household Income Correlation Summary
| Measurement | Immigrants from Turkey | Cambodian |
| Minimum | $75,893 | $14,319 |
| Maximum | $167,317 | $174,929 |
| Range | $91,424 | $160,610 |
| Mean | $108,335 | $90,039 |
| Median | $105,608 | $99,162 |
| Interquartile 25% (IQ1) | $87,245 | $65,313 |
| Interquartile 75% (IQ3) | $113,867 | $109,510 |
| Interquartile Range (IQR) | $26,622 | $44,197 |
| Standard Deviation (Sample) | $25,883 | $35,802 |
| Standard Deviation (Population) | $25,193 | $35,287 |
Demographics Similar to Immigrants from Turkey and Cambodians by Median Household Income
In terms of median household income, the demographic groups most similar to Immigrants from Turkey are Maltese ($97,015, a difference of 0.050%), Afghan ($97,026, a difference of 0.060%), Immigrants from Lithuania ($96,836, a difference of 0.13%), Immigrants from France ($96,743, a difference of 0.23%), and Immigrants from Greece ($96,675, a difference of 0.30%). Similarly, the demographic groups most similar to Cambodians are Immigrants from Malaysia ($96,292, a difference of 0.030%), Bulgarian ($96,290, a difference of 0.040%), Immigrants from Russia ($96,378, a difference of 0.060%), Australian ($96,490, a difference of 0.17%), and Israeli ($96,552, a difference of 0.24%).
| Demographics | Rating | Rank | Median Household Income |
| Russians | 100.0 /100 | #34 | Exceptional $98,008 |
| Immigrants | Switzerland | 100.0 /100 | #35 | Exceptional $97,979 |
| Immigrants | Pakistan | 100.0 /100 | #36 | Exceptional $97,528 |
| Latvians | 100.0 /100 | #37 | Exceptional $97,311 |
| Immigrants | Indonesia | 100.0 /100 | #38 | Exceptional $97,297 |
| Afghans | 100.0 /100 | #39 | Exceptional $97,026 |
| Maltese | 100.0 /100 | #40 | Exceptional $97,015 |
| Immigrants | Turkey | 100.0 /100 | #41 | Exceptional $96,964 |
| Immigrants | Lithuania | 99.9 /100 | #42 | Exceptional $96,836 |
| Immigrants | France | 99.9 /100 | #43 | Exceptional $96,743 |
| Immigrants | Greece | 99.9 /100 | #44 | Exceptional $96,675 |
| Israelis | 99.9 /100 | #45 | Exceptional $96,552 |
| Australians | 99.9 /100 | #46 | Exceptional $96,490 |
| Immigrants | Russia | 99.9 /100 | #47 | Exceptional $96,378 |
| Cambodians | 99.9 /100 | #48 | Exceptional $96,324 |
| Immigrants | Malaysia | 99.9 /100 | #49 | Exceptional $96,292 |
| Bulgarians | 99.9 /100 | #50 | Exceptional $96,290 |
| Estonians | 99.9 /100 | #51 | Exceptional $95,930 |
| Immigrants | South Africa | 99.9 /100 | #52 | Exceptional $95,800 |
| Paraguayans | 99.9 /100 | #53 | Exceptional $95,737 |
| Egyptians | 99.9 /100 | #54 | Exceptional $95,673 |