Salvadoran vs Immigrants from Latin America Median Family Income
COMPARE
Salvadoran
Immigrants from Latin America
Median Family Income
Median Family Income Comparison
Salvadorans
Immigrants from Latin America
$94,109
MEDIAN FAMILY INCOME
1.2/ 100
METRIC RATING
239th/ 347
METRIC RANK
$86,989
MEDIAN FAMILY INCOME
0.0/ 100
METRIC RATING
298th/ 347
METRIC RANK
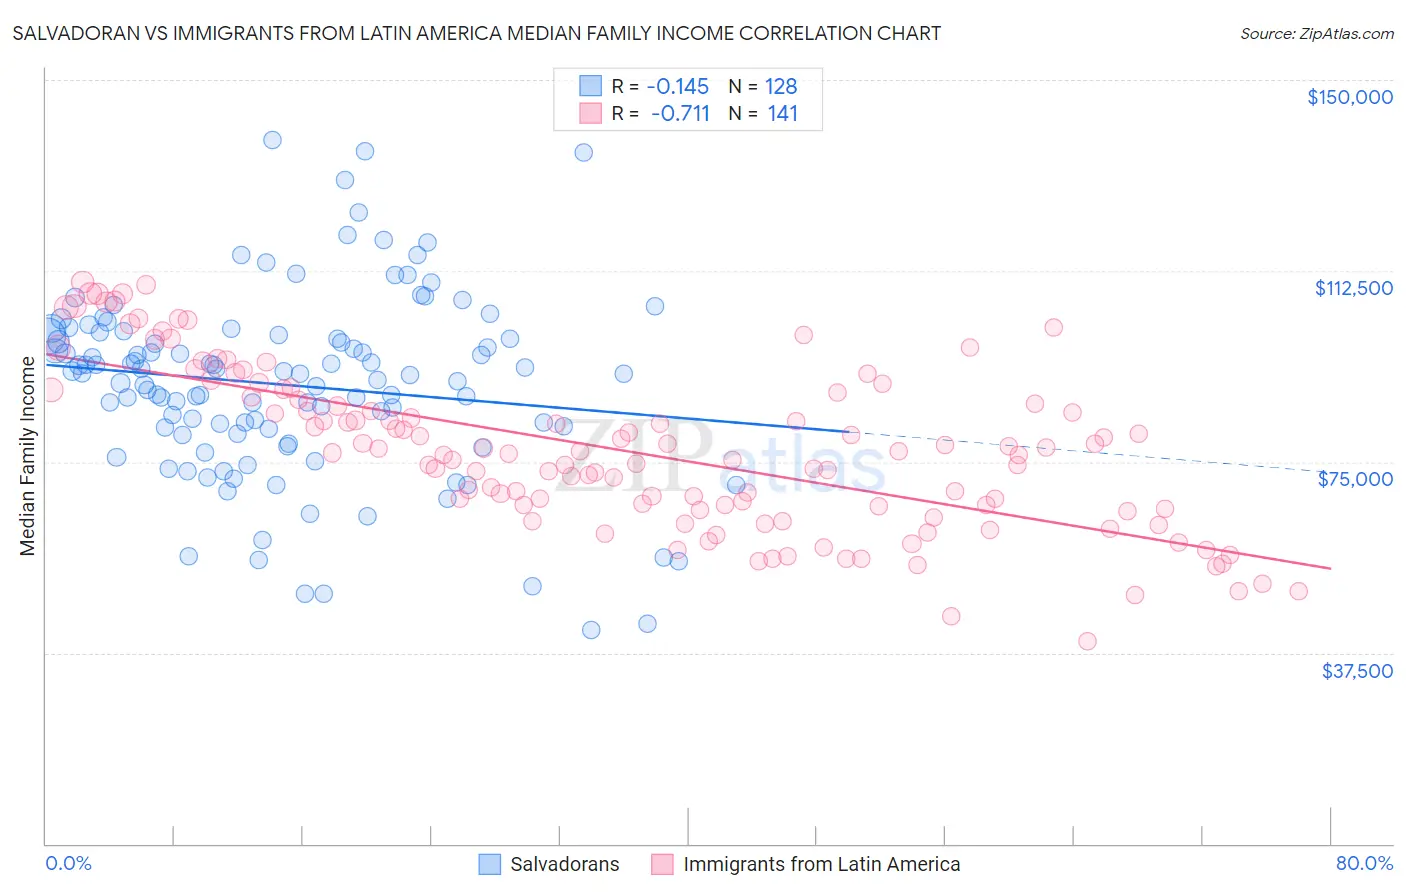
Salvadoran vs Immigrants from Latin America Median Family Income Correlation Chart
The statistical analysis conducted on geographies consisting of 398,577,694 people shows a poor negative correlation between the proportion of Salvadorans and median family income in the United States with a correlation coefficient (R) of -0.145 and weighted average of $94,109. Similarly, the statistical analysis conducted on geographies consisting of 557,337,898 people shows a strong negative correlation between the proportion of Immigrants from Latin America and median family income in the United States with a correlation coefficient (R) of -0.711 and weighted average of $86,989, a difference of 8.2%.
Median Family Income Correlation Summary
| Measurement | Salvadoran | Immigrants from Latin America |
| Minimum | $41,966 | $39,785 |
| Maximum | $138,117 | $110,302 |
| Range | $96,151 | $70,517 |
| Mean | $90,099 | $77,259 |
| Median | $92,329 | $76,749 |
| Interquartile 25% (IQ1) | $81,022 | $66,005 |
| Interquartile 75% (IQ3) | $99,847 | $88,129 |
| Interquartile Range (IQR) | $18,825 | $22,124 |
| Standard Deviation (Sample) | $18,212 | $15,813 |
| Standard Deviation (Population) | $18,141 | $15,756 |
Similar Demographics by Median Family Income
Demographics Similar to Salvadorans by Median Family Income
In terms of median family income, the demographic groups most similar to Salvadorans are Somali ($94,085, a difference of 0.030%), Nepalese ($94,153, a difference of 0.050%), Immigrants from Trinidad and Tobago ($93,988, a difference of 0.13%), Barbadian ($93,919, a difference of 0.20%), and German Russian ($93,858, a difference of 0.27%).
| Demographics | Rating | Rank | Median Family Income |
| Immigrants | Venezuela | 1.9 /100 | #232 | Tragic $94,904 |
| Immigrants | Bangladesh | 1.6 /100 | #233 | Tragic $94,665 |
| Immigrants | Western Africa | 1.6 /100 | #234 | Tragic $94,638 |
| Immigrants | Burma/Myanmar | 1.5 /100 | #235 | Tragic $94,472 |
| Trinidadians and Tobagonians | 1.5 /100 | #236 | Tragic $94,466 |
| Alaskan Athabascans | 1.5 /100 | #237 | Tragic $94,429 |
| Nepalese | 1.3 /100 | #238 | Tragic $94,153 |
| Salvadorans | 1.2 /100 | #239 | Tragic $94,109 |
| Somalis | 1.2 /100 | #240 | Tragic $94,085 |
| Immigrants | Trinidad and Tobago | 1.2 /100 | #241 | Tragic $93,988 |
| Barbadians | 1.1 /100 | #242 | Tragic $93,919 |
| German Russians | 1.1 /100 | #243 | Tragic $93,858 |
| Sub-Saharan Africans | 1.0 /100 | #244 | Tragic $93,748 |
| Immigrants | Middle Africa | 1.0 /100 | #245 | Tragic $93,593 |
| Guyanese | 0.9 /100 | #246 | Tragic $93,373 |
Demographics Similar to Immigrants from Latin America by Median Family Income
In terms of median family income, the demographic groups most similar to Immigrants from Latin America are Chippewa ($86,852, a difference of 0.16%), Cajun ($87,157, a difference of 0.19%), Immigrants from Guatemala ($87,191, a difference of 0.23%), Yaqui ($87,289, a difference of 0.34%), and Fijian ($87,387, a difference of 0.46%).
| Demographics | Rating | Rank | Median Family Income |
| Immigrants | Cabo Verde | 0.1 /100 | #291 | Tragic $87,830 |
| Africans | 0.1 /100 | #292 | Tragic $87,820 |
| Ute | 0.0 /100 | #293 | Tragic $87,596 |
| Fijians | 0.0 /100 | #294 | Tragic $87,387 |
| Yaqui | 0.0 /100 | #295 | Tragic $87,289 |
| Immigrants | Guatemala | 0.0 /100 | #296 | Tragic $87,191 |
| Cajuns | 0.0 /100 | #297 | Tragic $87,157 |
| Immigrants | Latin America | 0.0 /100 | #298 | Tragic $86,989 |
| Chippewa | 0.0 /100 | #299 | Tragic $86,852 |
| Ottawa | 0.0 /100 | #300 | Tragic $86,380 |
| Colville | 0.0 /100 | #301 | Tragic $85,792 |
| Spanish American Indians | 0.0 /100 | #302 | Tragic $85,728 |
| Hispanics or Latinos | 0.0 /100 | #303 | Tragic $85,647 |
| Mexicans | 0.0 /100 | #304 | Tragic $85,618 |
| Paiute | 0.0 /100 | #305 | Tragic $85,414 |