Immigrants from Moldova vs Immigrants from Latin America Median Family Income
COMPARE
Immigrants from Moldova
Immigrants from Latin America
Median Family Income
Median Family Income Comparison
Immigrants from Moldova
Immigrants from Latin America
$109,975
MEDIAN FAMILY INCOME
97.7/ 100
METRIC RATING
96th/ 347
METRIC RANK
$86,989
MEDIAN FAMILY INCOME
0.0/ 100
METRIC RATING
298th/ 347
METRIC RANK
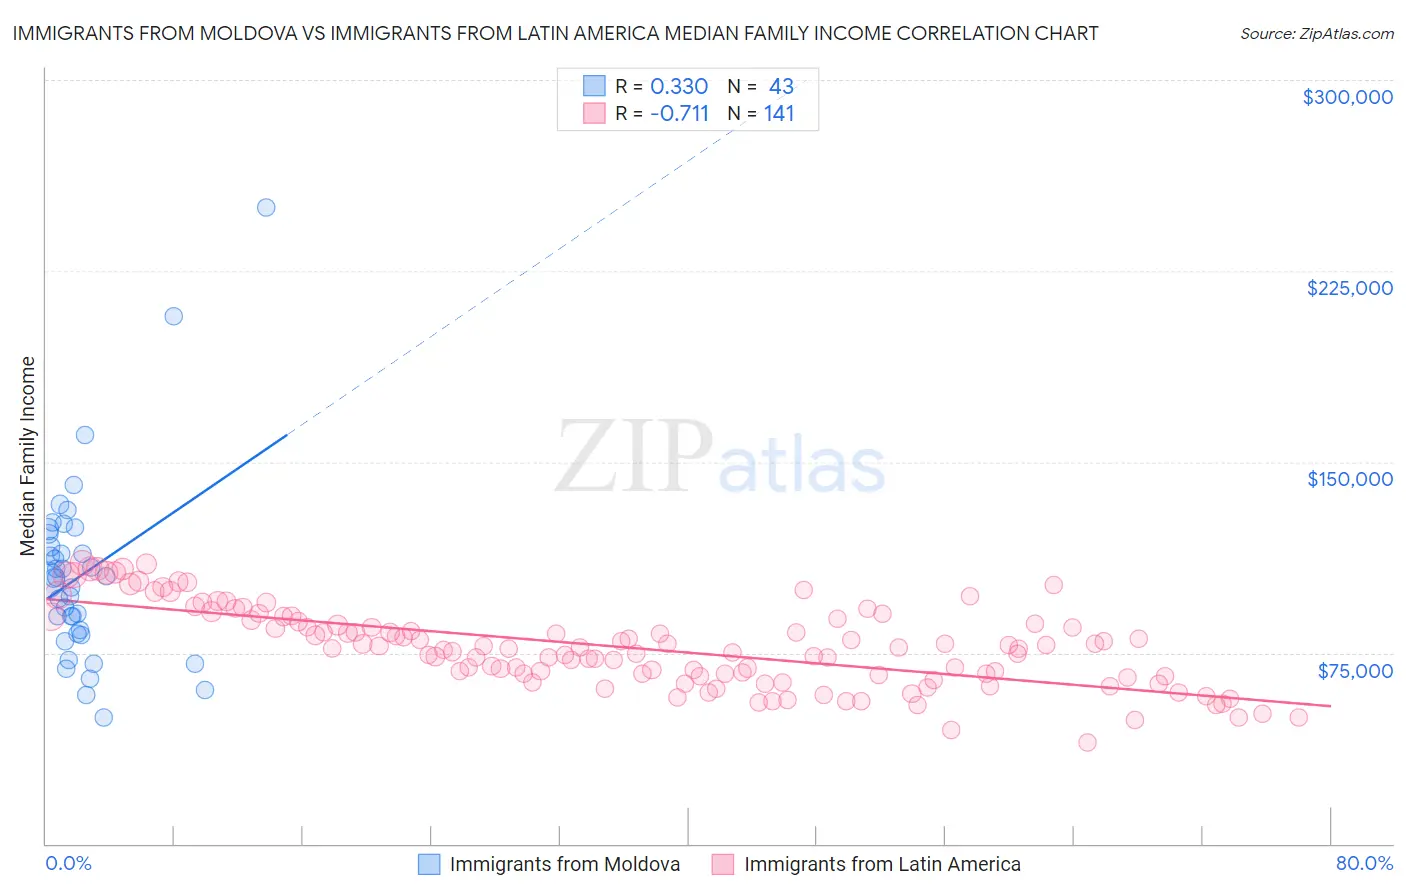
Immigrants from Moldova vs Immigrants from Latin America Median Family Income Correlation Chart
The statistical analysis conducted on geographies consisting of 124,358,975 people shows a mild positive correlation between the proportion of Immigrants from Moldova and median family income in the United States with a correlation coefficient (R) of 0.330 and weighted average of $109,975. Similarly, the statistical analysis conducted on geographies consisting of 557,337,898 people shows a strong negative correlation between the proportion of Immigrants from Latin America and median family income in the United States with a correlation coefficient (R) of -0.711 and weighted average of $86,989, a difference of 26.4%.
Median Family Income Correlation Summary
| Measurement | Immigrants from Moldova | Immigrants from Latin America |
| Minimum | $49,474 | $39,785 |
| Maximum | $250,001 | $110,302 |
| Range | $200,527 | $70,517 |
| Mean | $105,716 | $77,259 |
| Median | $104,398 | $76,749 |
| Interquartile 25% (IQ1) | $82,625 | $66,005 |
| Interquartile 75% (IQ3) | $121,587 | $88,129 |
| Interquartile Range (IQR) | $38,962 | $22,124 |
| Standard Deviation (Sample) | $36,710 | $15,813 |
| Standard Deviation (Population) | $36,280 | $15,756 |
Similar Demographics by Median Family Income
Demographics Similar to Immigrants from Moldova by Median Family Income
In terms of median family income, the demographic groups most similar to Immigrants from Moldova are Zimbabwean ($110,011, a difference of 0.030%), Jordanian ($109,865, a difference of 0.10%), Korean ($110,103, a difference of 0.12%), Immigrants from Kazakhstan ($110,137, a difference of 0.15%), and Immigrants from Lebanon ($110,159, a difference of 0.17%).
| Demographics | Rating | Rank | Median Family Income |
| Immigrants | Argentina | 98.5 /100 | #89 | Exceptional $110,873 |
| Northern Europeans | 98.3 /100 | #90 | Exceptional $110,635 |
| Immigrants | Southern Europe | 98.3 /100 | #91 | Exceptional $110,614 |
| Immigrants | Lebanon | 97.9 /100 | #92 | Exceptional $110,159 |
| Immigrants | Kazakhstan | 97.8 /100 | #93 | Exceptional $110,137 |
| Koreans | 97.8 /100 | #94 | Exceptional $110,103 |
| Zimbabweans | 97.7 /100 | #95 | Exceptional $110,011 |
| Immigrants | Moldova | 97.7 /100 | #96 | Exceptional $109,975 |
| Jordanians | 97.5 /100 | #97 | Exceptional $109,865 |
| Immigrants | Kuwait | 97.4 /100 | #98 | Exceptional $109,731 |
| Armenians | 97.3 /100 | #99 | Exceptional $109,692 |
| Macedonians | 97.3 /100 | #100 | Exceptional $109,668 |
| Immigrants | Ukraine | 97.2 /100 | #101 | Exceptional $109,645 |
| Assyrians/Chaldeans/Syriacs | 97.2 /100 | #102 | Exceptional $109,622 |
| Immigrants | Brazil | 96.9 /100 | #103 | Exceptional $109,418 |
Demographics Similar to Immigrants from Latin America by Median Family Income
In terms of median family income, the demographic groups most similar to Immigrants from Latin America are Chippewa ($86,852, a difference of 0.16%), Cajun ($87,157, a difference of 0.19%), Immigrants from Guatemala ($87,191, a difference of 0.23%), Yaqui ($87,289, a difference of 0.34%), and Fijian ($87,387, a difference of 0.46%).
| Demographics | Rating | Rank | Median Family Income |
| Immigrants | Cabo Verde | 0.1 /100 | #291 | Tragic $87,830 |
| Africans | 0.1 /100 | #292 | Tragic $87,820 |
| Ute | 0.0 /100 | #293 | Tragic $87,596 |
| Fijians | 0.0 /100 | #294 | Tragic $87,387 |
| Yaqui | 0.0 /100 | #295 | Tragic $87,289 |
| Immigrants | Guatemala | 0.0 /100 | #296 | Tragic $87,191 |
| Cajuns | 0.0 /100 | #297 | Tragic $87,157 |
| Immigrants | Latin America | 0.0 /100 | #298 | Tragic $86,989 |
| Chippewa | 0.0 /100 | #299 | Tragic $86,852 |
| Ottawa | 0.0 /100 | #300 | Tragic $86,380 |
| Colville | 0.0 /100 | #301 | Tragic $85,792 |
| Spanish American Indians | 0.0 /100 | #302 | Tragic $85,728 |
| Hispanics or Latinos | 0.0 /100 | #303 | Tragic $85,647 |
| Mexicans | 0.0 /100 | #304 | Tragic $85,618 |
| Paiute | 0.0 /100 | #305 | Tragic $85,414 |