Salvadoran vs Romanian Median Family Income
COMPARE
Salvadoran
Romanian
Median Family Income
Median Family Income Comparison
Salvadorans
Romanians
$94,109
MEDIAN FAMILY INCOME
1.2/ 100
METRIC RATING
239th/ 347
METRIC RANK
$111,243
MEDIAN FAMILY INCOME
98.8/ 100
METRIC RATING
88th/ 347
METRIC RANK
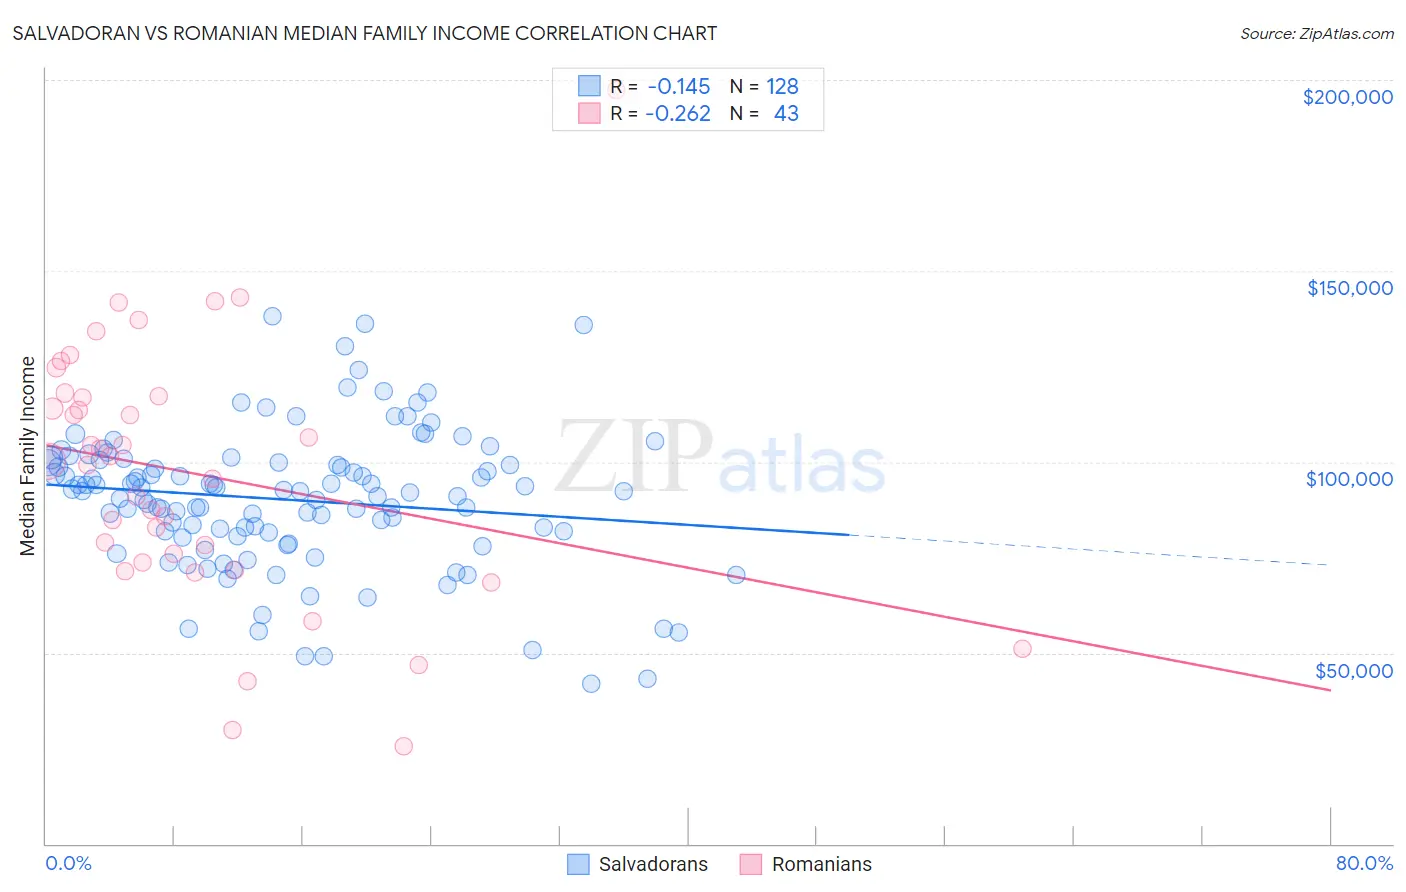
Salvadoran vs Romanian Median Family Income Correlation Chart
The statistical analysis conducted on geographies consisting of 398,577,694 people shows a poor negative correlation between the proportion of Salvadorans and median family income in the United States with a correlation coefficient (R) of -0.145 and weighted average of $94,109. Similarly, the statistical analysis conducted on geographies consisting of 377,611,628 people shows a weak negative correlation between the proportion of Romanians and median family income in the United States with a correlation coefficient (R) of -0.262 and weighted average of $111,243, a difference of 18.2%.
Median Family Income Correlation Summary
| Measurement | Salvadoran | Romanian |
| Minimum | $41,966 | $25,417 |
| Maximum | $138,117 | $197,500 |
| Range | $96,151 | $172,083 |
| Mean | $90,099 | $96,934 |
| Median | $92,329 | $100,017 |
| Interquartile 25% (IQ1) | $81,022 | $73,551 |
| Interquartile 75% (IQ3) | $99,847 | $117,024 |
| Interquartile Range (IQR) | $18,825 | $43,473 |
| Standard Deviation (Sample) | $18,212 | $33,876 |
| Standard Deviation (Population) | $18,141 | $33,480 |
Similar Demographics by Median Family Income
Demographics Similar to Salvadorans by Median Family Income
In terms of median family income, the demographic groups most similar to Salvadorans are Somali ($94,085, a difference of 0.030%), Nepalese ($94,153, a difference of 0.050%), Immigrants from Trinidad and Tobago ($93,988, a difference of 0.13%), Barbadian ($93,919, a difference of 0.20%), and German Russian ($93,858, a difference of 0.27%).
| Demographics | Rating | Rank | Median Family Income |
| Immigrants | Venezuela | 1.9 /100 | #232 | Tragic $94,904 |
| Immigrants | Bangladesh | 1.6 /100 | #233 | Tragic $94,665 |
| Immigrants | Western Africa | 1.6 /100 | #234 | Tragic $94,638 |
| Immigrants | Burma/Myanmar | 1.5 /100 | #235 | Tragic $94,472 |
| Trinidadians and Tobagonians | 1.5 /100 | #236 | Tragic $94,466 |
| Alaskan Athabascans | 1.5 /100 | #237 | Tragic $94,429 |
| Nepalese | 1.3 /100 | #238 | Tragic $94,153 |
| Salvadorans | 1.2 /100 | #239 | Tragic $94,109 |
| Somalis | 1.2 /100 | #240 | Tragic $94,085 |
| Immigrants | Trinidad and Tobago | 1.2 /100 | #241 | Tragic $93,988 |
| Barbadians | 1.1 /100 | #242 | Tragic $93,919 |
| German Russians | 1.1 /100 | #243 | Tragic $93,858 |
| Sub-Saharan Africans | 1.0 /100 | #244 | Tragic $93,748 |
| Immigrants | Middle Africa | 1.0 /100 | #245 | Tragic $93,593 |
| Guyanese | 0.9 /100 | #246 | Tragic $93,373 |
Demographics Similar to Romanians by Median Family Income
In terms of median family income, the demographic groups most similar to Romanians are Austrian ($111,306, a difference of 0.060%), Croatian ($111,370, a difference of 0.11%), Ukrainian ($111,368, a difference of 0.11%), Immigrants from Hungary ($111,378, a difference of 0.12%), and Immigrants from Argentina ($110,873, a difference of 0.33%).
| Demographics | Rating | Rank | Median Family Income |
| Immigrants | North America | 99.2 /100 | #81 | Exceptional $112,151 |
| Immigrants | England | 99.2 /100 | #82 | Exceptional $112,038 |
| Immigrants | Egypt | 99.0 /100 | #83 | Exceptional $111,689 |
| Immigrants | Hungary | 98.8 /100 | #84 | Exceptional $111,378 |
| Croatians | 98.8 /100 | #85 | Exceptional $111,370 |
| Ukrainians | 98.8 /100 | #86 | Exceptional $111,368 |
| Austrians | 98.8 /100 | #87 | Exceptional $111,306 |
| Romanians | 98.8 /100 | #88 | Exceptional $111,243 |
| Immigrants | Argentina | 98.5 /100 | #89 | Exceptional $110,873 |
| Northern Europeans | 98.3 /100 | #90 | Exceptional $110,635 |
| Immigrants | Southern Europe | 98.3 /100 | #91 | Exceptional $110,614 |
| Immigrants | Lebanon | 97.9 /100 | #92 | Exceptional $110,159 |
| Immigrants | Kazakhstan | 97.8 /100 | #93 | Exceptional $110,137 |
| Koreans | 97.8 /100 | #94 | Exceptional $110,103 |
| Zimbabweans | 97.7 /100 | #95 | Exceptional $110,011 |