Burmese vs Immigrants from Latin America Median Family Income
COMPARE
Burmese
Immigrants from Latin America
Median Family Income
Median Family Income Comparison
Burmese
Immigrants from Latin America
$123,369
MEDIAN FAMILY INCOME
100.0/ 100
METRIC RATING
20th/ 347
METRIC RANK
$86,989
MEDIAN FAMILY INCOME
0.0/ 100
METRIC RATING
298th/ 347
METRIC RANK
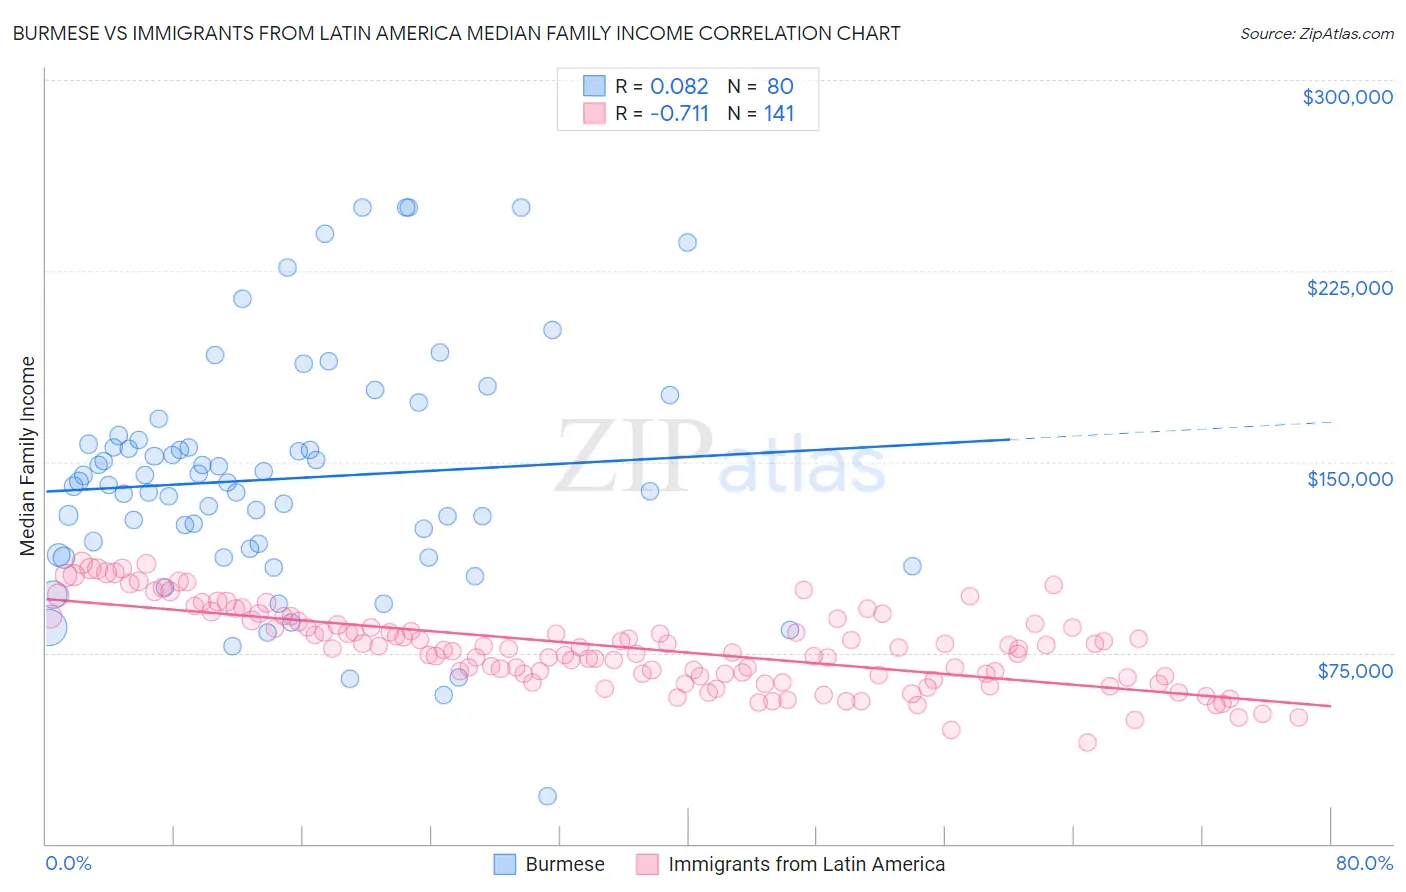
Burmese vs Immigrants from Latin America Median Family Income Correlation Chart
The statistical analysis conducted on geographies consisting of 464,661,736 people shows a slight positive correlation between the proportion of Burmese and median family income in the United States with a correlation coefficient (R) of 0.082 and weighted average of $123,369. Similarly, the statistical analysis conducted on geographies consisting of 557,337,898 people shows a strong negative correlation between the proportion of Immigrants from Latin America and median family income in the United States with a correlation coefficient (R) of -0.711 and weighted average of $86,989, a difference of 41.8%.
Median Family Income Correlation Summary
| Measurement | Burmese | Immigrants from Latin America |
| Minimum | $18,796 | $39,785 |
| Maximum | $250,001 | $110,302 |
| Range | $231,205 | $70,517 |
| Mean | $143,360 | $77,259 |
| Median | $141,361 | $76,749 |
| Interquartile 25% (IQ1) | $114,595 | $66,005 |
| Interquartile 75% (IQ3) | $157,872 | $88,129 |
| Interquartile Range (IQR) | $43,276 | $22,124 |
| Standard Deviation (Sample) | $46,200 | $15,813 |
| Standard Deviation (Population) | $45,911 | $15,756 |
Similar Demographics by Median Family Income
Demographics Similar to Burmese by Median Family Income
In terms of median family income, the demographic groups most similar to Burmese are Immigrants from Belgium ($123,831, a difference of 0.37%), Immigrants from Korea ($122,800, a difference of 0.46%), Immigrants from Sweden ($122,765, a difference of 0.49%), Immigrants from Japan ($122,764, a difference of 0.49%), and Immigrants from Northern Europe ($121,840, a difference of 1.3%).
| Demographics | Rating | Rank | Median Family Income |
| Immigrants | Australia | 100.0 /100 | #13 | Exceptional $126,620 |
| Immigrants | South Central Asia | 100.0 /100 | #14 | Exceptional $125,956 |
| Eastern Europeans | 100.0 /100 | #15 | Exceptional $125,546 |
| Immigrants | China | 100.0 /100 | #16 | Exceptional $125,540 |
| Indians (Asian) | 100.0 /100 | #17 | Exceptional $125,312 |
| Immigrants | Eastern Asia | 100.0 /100 | #18 | Exceptional $125,150 |
| Immigrants | Belgium | 100.0 /100 | #19 | Exceptional $123,831 |
| Burmese | 100.0 /100 | #20 | Exceptional $123,369 |
| Immigrants | Korea | 100.0 /100 | #21 | Exceptional $122,800 |
| Immigrants | Sweden | 100.0 /100 | #22 | Exceptional $122,765 |
| Immigrants | Japan | 100.0 /100 | #23 | Exceptional $122,764 |
| Immigrants | Northern Europe | 100.0 /100 | #24 | Exceptional $121,840 |
| Turks | 100.0 /100 | #25 | Exceptional $121,202 |
| Immigrants | Switzerland | 100.0 /100 | #26 | Exceptional $120,726 |
| Russians | 100.0 /100 | #27 | Exceptional $120,487 |
Demographics Similar to Immigrants from Latin America by Median Family Income
In terms of median family income, the demographic groups most similar to Immigrants from Latin America are Chippewa ($86,852, a difference of 0.16%), Cajun ($87,157, a difference of 0.19%), Immigrants from Guatemala ($87,191, a difference of 0.23%), Yaqui ($87,289, a difference of 0.34%), and Fijian ($87,387, a difference of 0.46%).
| Demographics | Rating | Rank | Median Family Income |
| Immigrants | Cabo Verde | 0.1 /100 | #291 | Tragic $87,830 |
| Africans | 0.1 /100 | #292 | Tragic $87,820 |
| Ute | 0.0 /100 | #293 | Tragic $87,596 |
| Fijians | 0.0 /100 | #294 | Tragic $87,387 |
| Yaqui | 0.0 /100 | #295 | Tragic $87,289 |
| Immigrants | Guatemala | 0.0 /100 | #296 | Tragic $87,191 |
| Cajuns | 0.0 /100 | #297 | Tragic $87,157 |
| Immigrants | Latin America | 0.0 /100 | #298 | Tragic $86,989 |
| Chippewa | 0.0 /100 | #299 | Tragic $86,852 |
| Ottawa | 0.0 /100 | #300 | Tragic $86,380 |
| Colville | 0.0 /100 | #301 | Tragic $85,792 |
| Spanish American Indians | 0.0 /100 | #302 | Tragic $85,728 |
| Hispanics or Latinos | 0.0 /100 | #303 | Tragic $85,647 |
| Mexicans | 0.0 /100 | #304 | Tragic $85,618 |
| Paiute | 0.0 /100 | #305 | Tragic $85,414 |