Salvadoran vs Immigrants from Guyana Median Family Income
COMPARE
Salvadoran
Immigrants from Guyana
Median Family Income
Median Family Income Comparison
Salvadorans
Immigrants from Guyana
$94,109
MEDIAN FAMILY INCOME
1.2/ 100
METRIC RATING
239th/ 347
METRIC RANK
$92,513
MEDIAN FAMILY INCOME
0.6/ 100
METRIC RATING
253rd/ 347
METRIC RANK
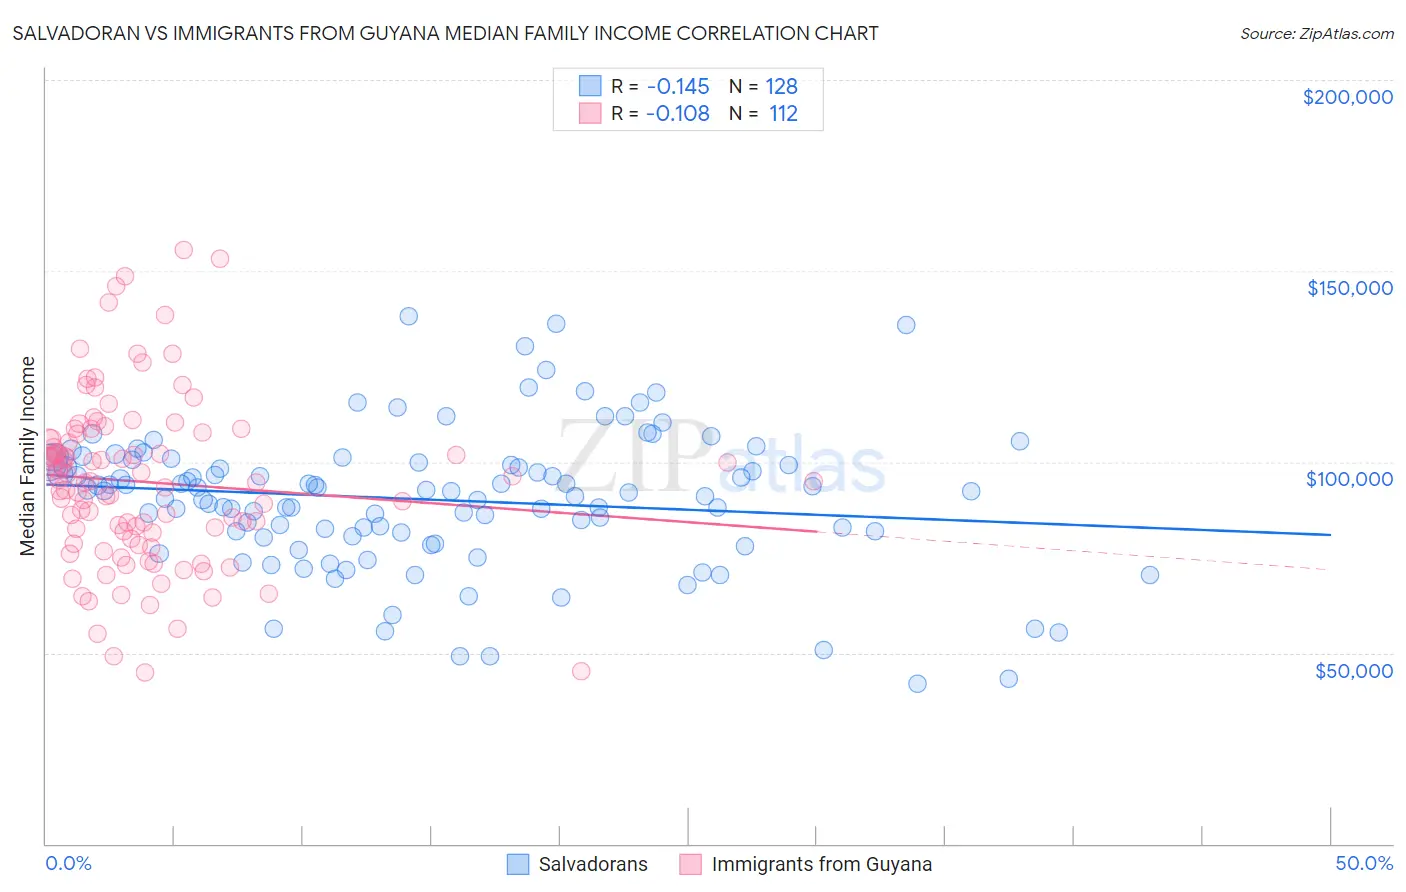
Salvadoran vs Immigrants from Guyana Median Family Income Correlation Chart
The statistical analysis conducted on geographies consisting of 398,577,694 people shows a poor negative correlation between the proportion of Salvadorans and median family income in the United States with a correlation coefficient (R) of -0.145 and weighted average of $94,109. Similarly, the statistical analysis conducted on geographies consisting of 183,650,317 people shows a poor negative correlation between the proportion of Immigrants from Guyana and median family income in the United States with a correlation coefficient (R) of -0.108 and weighted average of $92,513, a difference of 1.7%.
Median Family Income Correlation Summary
| Measurement | Salvadoran | Immigrants from Guyana |
| Minimum | $41,966 | $44,715 |
| Maximum | $138,117 | $155,346 |
| Range | $96,151 | $110,631 |
| Mean | $90,099 | $94,705 |
| Median | $92,329 | $94,807 |
| Interquartile 25% (IQ1) | $81,022 | $80,722 |
| Interquartile 75% (IQ3) | $99,847 | $106,748 |
| Interquartile Range (IQR) | $18,825 | $26,026 |
| Standard Deviation (Sample) | $18,212 | $22,061 |
| Standard Deviation (Population) | $18,141 | $21,962 |
Demographics Similar to Salvadorans and Immigrants from Guyana by Median Family Income
In terms of median family income, the demographic groups most similar to Salvadorans are Somali ($94,085, a difference of 0.030%), Nepalese ($94,153, a difference of 0.050%), Immigrants from Trinidad and Tobago ($93,988, a difference of 0.13%), Barbadian ($93,919, a difference of 0.20%), and German Russian ($93,858, a difference of 0.27%). Similarly, the demographic groups most similar to Immigrants from Guyana are Immigrants from El Salvador ($92,545, a difference of 0.030%), Immigrants from Somalia ($92,609, a difference of 0.10%), Immigrants from Barbados ($92,419, a difference of 0.10%), West Indian ($92,765, a difference of 0.27%), and Immigrants from Laos ($92,239, a difference of 0.30%).
| Demographics | Rating | Rank | Median Family Income |
| Trinidadians and Tobagonians | 1.5 /100 | #236 | Tragic $94,466 |
| Alaskan Athabascans | 1.5 /100 | #237 | Tragic $94,429 |
| Nepalese | 1.3 /100 | #238 | Tragic $94,153 |
| Salvadorans | 1.2 /100 | #239 | Tragic $94,109 |
| Somalis | 1.2 /100 | #240 | Tragic $94,085 |
| Immigrants | Trinidad and Tobago | 1.2 /100 | #241 | Tragic $93,988 |
| Barbadians | 1.1 /100 | #242 | Tragic $93,919 |
| German Russians | 1.1 /100 | #243 | Tragic $93,858 |
| Sub-Saharan Africans | 1.0 /100 | #244 | Tragic $93,748 |
| Immigrants | Middle Africa | 1.0 /100 | #245 | Tragic $93,593 |
| Guyanese | 0.9 /100 | #246 | Tragic $93,373 |
| Immigrants | Senegal | 0.7 /100 | #247 | Tragic $92,912 |
| French American Indians | 0.7 /100 | #248 | Tragic $92,872 |
| Immigrants | Ecuador | 0.7 /100 | #249 | Tragic $92,837 |
| West Indians | 0.6 /100 | #250 | Tragic $92,765 |
| Immigrants | Somalia | 0.6 /100 | #251 | Tragic $92,609 |
| Immigrants | El Salvador | 0.6 /100 | #252 | Tragic $92,545 |
| Immigrants | Guyana | 0.6 /100 | #253 | Tragic $92,513 |
| Immigrants | Barbados | 0.5 /100 | #254 | Tragic $92,419 |
| Immigrants | Laos | 0.5 /100 | #255 | Tragic $92,239 |
| Nicaraguans | 0.5 /100 | #256 | Tragic $92,231 |