Polish vs Immigrants from Vietnam Median Male Earnings
COMPARE
Polish
Immigrants from Vietnam
Median Male Earnings
Median Male Earnings Comparison
Poles
Immigrants from Vietnam
$58,139
MEDIAN MALE EARNINGS
97.3/ 100
METRIC RATING
103rd/ 347
METRIC RANK
$54,913
MEDIAN MALE EARNINGS
60.2/ 100
METRIC RATING
168th/ 347
METRIC RANK
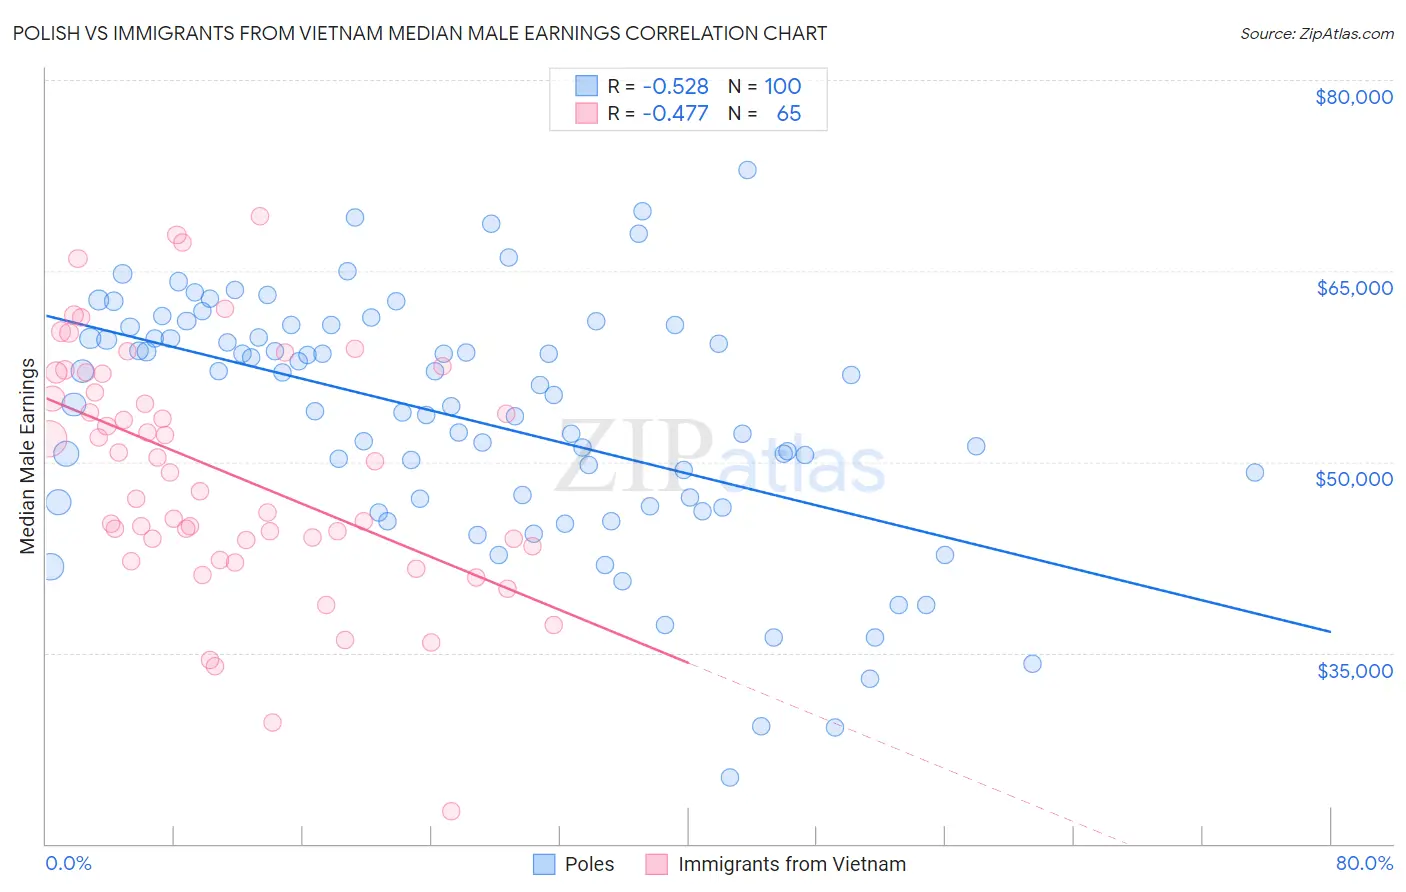
Polish vs Immigrants from Vietnam Median Male Earnings Correlation Chart
The statistical analysis conducted on geographies consisting of 559,585,611 people shows a substantial negative correlation between the proportion of Poles and median male earnings in the United States with a correlation coefficient (R) of -0.528 and weighted average of $58,139. Similarly, the statistical analysis conducted on geographies consisting of 404,603,118 people shows a moderate negative correlation between the proportion of Immigrants from Vietnam and median male earnings in the United States with a correlation coefficient (R) of -0.477 and weighted average of $54,913, a difference of 5.9%.
Median Male Earnings Correlation Summary
| Measurement | Polish | Immigrants from Vietnam |
| Minimum | $25,204 | $22,532 |
| Maximum | $72,933 | $69,274 |
| Range | $47,729 | $46,742 |
| Mean | $53,382 | $49,248 |
| Median | $54,879 | $49,189 |
| Interquartile 25% (IQ1) | $46,953 | $43,623 |
| Interquartile 75% (IQ3) | $60,187 | $56,949 |
| Interquartile Range (IQR) | $13,234 | $13,326 |
| Standard Deviation (Sample) | $9,652 | $9,503 |
| Standard Deviation (Population) | $9,604 | $9,429 |
Similar Demographics by Median Male Earnings
Demographics Similar to Poles by Median Male Earnings
In terms of median male earnings, the demographic groups most similar to Poles are Armenian ($58,134, a difference of 0.010%), Immigrants from Western Asia ($58,131, a difference of 0.020%), Syrian ($58,187, a difference of 0.080%), Immigrants from Northern Africa ($58,008, a difference of 0.23%), and Serbian ($57,975, a difference of 0.28%).
| Demographics | Rating | Rank | Median Male Earnings |
| Albanians | 98.4 /100 | #96 | Exceptional $58,680 |
| Northern Europeans | 98.2 /100 | #97 | Exceptional $58,588 |
| Jordanians | 98.1 /100 | #98 | Exceptional $58,500 |
| Immigrants | Poland | 98.0 /100 | #99 | Exceptional $58,452 |
| Assyrians/Chaldeans/Syriacs | 97.9 /100 | #100 | Exceptional $58,437 |
| Immigrants | Brazil | 97.7 /100 | #101 | Exceptional $58,324 |
| Syrians | 97.4 /100 | #102 | Exceptional $58,187 |
| Poles | 97.3 /100 | #103 | Exceptional $58,139 |
| Armenians | 97.3 /100 | #104 | Exceptional $58,134 |
| Immigrants | Western Asia | 97.3 /100 | #105 | Exceptional $58,131 |
| Immigrants | Northern Africa | 96.9 /100 | #106 | Exceptional $58,008 |
| Serbians | 96.8 /100 | #107 | Exceptional $57,975 |
| Immigrants | Uzbekistan | 96.7 /100 | #108 | Exceptional $57,941 |
| British | 96.5 /100 | #109 | Exceptional $57,890 |
| Palestinians | 96.2 /100 | #110 | Exceptional $57,778 |
Demographics Similar to Immigrants from Vietnam by Median Male Earnings
In terms of median male earnings, the demographic groups most similar to Immigrants from Vietnam are Immigrants from Fiji ($54,958, a difference of 0.080%), German ($54,974, a difference of 0.11%), French Canadian ($54,722, a difference of 0.35%), Finnish ($54,721, a difference of 0.35%), and Immigrants from Peru ($54,695, a difference of 0.40%).
| Demographics | Rating | Rank | Median Male Earnings |
| Belgians | 70.1 /100 | #161 | Good $55,361 |
| French | 69.9 /100 | #162 | Good $55,350 |
| Ugandans | 68.6 /100 | #163 | Good $55,290 |
| Immigrants | South Eastern Asia | 67.6 /100 | #164 | Good $55,241 |
| Immigrants | Portugal | 66.3 /100 | #165 | Good $55,182 |
| Germans | 61.6 /100 | #166 | Good $54,974 |
| Immigrants | Fiji | 61.2 /100 | #167 | Good $54,958 |
| Immigrants | Vietnam | 60.2 /100 | #168 | Good $54,913 |
| French Canadians | 55.6 /100 | #169 | Average $54,722 |
| Finns | 55.6 /100 | #170 | Average $54,721 |
| Immigrants | Peru | 54.9 /100 | #171 | Average $54,695 |
| Welsh | 53.8 /100 | #172 | Average $54,647 |
| South American Indians | 50.4 /100 | #173 | Average $54,508 |
| South Americans | 50.0 /100 | #174 | Average $54,492 |
| Dutch | 48.0 /100 | #175 | Average $54,410 |